Last month, Secretary of Defense James Mattis urged Congress to allow the Pentagon to reduce its excess overhead. Mattis has requested this authority before — as have at least four of his predecessors (Carter, Panetta, Hagel and Gates) — but the latest request accompanies a new Pentagon report that assesses the military’s infrastructure needs based on a much larger force structure than the one it has today. Even if the military, and especially the Army, were to grow back to the levels seen when the United States was actively fighting wars in both Afghanistan and Iraq (2012), the DoD is carrying 19 percent excess capacity. Such waste clearly impacts military effectiveness. As Mattis explained in a letter accompanying the report, “every unnecessary facility we maintain requires us to cut capabilities elsewhere.” Although the leading Democrat on the House Armed Services Committee, Adam Smith (D‑WA), and a handful of other lawmakers, agree with Mattis’s assessment, and would allow the Pentagon to cut such obviously wasteful spending, many others in Congress remain opposed to a new round of base closures. Kay Granger (R‑TX), chairwoman of the House Appropriations Subcommittee on Defense said in May that she had “never seen [BRAC] save much money.” Sen. Jim Inhofe (R‑OK) called plans for base closure “disappointing” and “dangerous.” “Clearly, base closure rounds,” Inhofe wrote in September, “cost the American taxpayers an exorbitant amount of money upfront and take years to recoup the initial investment.” This is incorrect. The closure of hundreds of unnecessary military bases in five successive BRAC rounds have saved American taxpayers billions of dollars. Even the much-maligned fifth and final BRAC round, initiated in 2005, is expected to deliver net savings in 2018. Secretary Mattis explained in testimony before the Senate Armed Services Committee in June that a “properly focused base closure effort” could generate $2 billion or more annually. But we shouldn’t assess the benefits of base closures solely on the basis of possible savings to the Department of Defense; that amounts to looking through the wrong end of the telescope. Although BRAC does generate real savings, the greater economic benefits accrue to communities near affected bases when they put underutilized facilities to more productive uses. In that sense, military bases aren’t closed, they’re opened. I visited such a place on Wednesday: the former Glenview Naval Air Station, about 20 miles northwest of Chicago. During World War II, the Navy trained pilots to land on aircraft carriers, in this case two converted passenger steamers on Lake Michigan. The Navy didn’t have actual aircraft carriers to spare. More than 17,000 naval aviators underwent training at Glenview, including George H.W. Bush. But the naval air station was included in the 1993 BRAC list, and Glenview took charge of clearing some 1100 acres, funded infrastructure improvements, and subdivided and sold parcels to private developers. About 400 acres were preserved as open space and parkland. To the untrained eye, few would realize that there was ever a naval base here. I’ve been aware of Glenview for years, even though I had never visited before. I knew what to look for. The street names betray the area’s storied past. Independence and Constitution Avenues are pretty common, and one even encounters the occasional Patriot Boulevard. But one doesn’t often find Nimitz Drive, Kitty Hawk Lane, or Admiral Court in a typical American subdivision. The beautiful homes, many with three-car garages, and backing to golf courses and open space, command top dollar on the real estate market. A review of a few of the listings for the houses with For Sale signs on their front lawns found asking prices between $760,000 and $875,000. Phoebe Co, a realtor with Berkshire Hathaway, explained that condos in the area go for as low as $300,000, but some of the newer townhomes sell for $800,000 or more. Single family homes selling for more than $1 million are not atypical. Glenview is a coveted location not merely for its pleasant neighborhoods, and ample green space with bike and walking paths. It is also in close proximity to the headquarters of a number of Fortune 500 companies (we drove past Allstate’s sprawling campus on the way back to O’Hare), and an easy commute to downtown Chicago — about 40 minutes by train during rush hour. The centerpiece of Glenview’s redevelopment of the former base property is The Glen Town Center, which includes retail shops at street level, and apartments above them for rent. These properties are ringed by attractive brick rowhomes. Here one finds the most visible remaining remnant of the former base: the air station’s control tower is now home to a Dick’s Sporting Goods, a Carter’s children clothing store, and a Von Maur department store. Three statues – a pilot, a sailor, and a ground crewman – stand around a fountain across the street. Painted plaques by the store fronts celebrate the many units that served at the base. Jeanne Fields, assistant property manager for the Aloft apartments, explained that renters value the convenience of living so close to shopping and dining. The Glen is “very unique,” Fields said. “You don’t usually have urban style living in the suburbs.” People who want city living without the city can get it at The Glen. And they’re willing to pay: rentals start at $1600 for a 1 bedroom, and go as high as $5000 for the largest two-bedroom unit. Fields reported that more than 90 percent of the units are currently occupied. I strolled around The Glen with my colleague Harrison Moar, stopped in at the ubiquitous Starbucks, and ate lunch at the Yard House (allegedly home of the “World’s Largest Selection of Draft Beers”). The sprawling restaurant can accommodate 250 diners, and seemed surprisingly busy for a Tuesday at Noon. The many families with young children probably weren’t there for the 100+ beers on tap, but Harrison and I might have tried one. Alex at the front told us that this was a pretty typical lunchtime crowd, and that the restaurant was even busier later in the week, and on weekends. Those who believe that base closures will devastate a local economy need to be aware of cases like Glenview (and Philadelphia, and San Francisco, and San Antonio, and Brunswick). To be sure, some places will take longer to recover (e.g. Brooklyn), and a few might never see economic activity comparable to when the nearby bases boomed (e.g. Limestone, Maine). But those who would keep unnecessary military bases open in order to shield local communities from the possible negative economic impacts are saying, in effect, that their parochial concerns should outweigh the needs of the nation. And elected officials who doubt that their base will ever be successfully converted betray a curious lack of faith in their own constituents’ ability to make productive use of valuable real estate.
Cato at Liberty
Cato at Liberty
Topics
General
Is Supporting Racists’ Free Speech Rights the Same as Being a Racist?
Student protesters at the College of William and Mary recently shut down a campus speaker from the ACLU invited (ironically) to speak about “Students and the First Amendment.” Students explained their shut down was in retaliation for the ACLU’s defense of white nationalists’ free speech rights in Charlottesville, Virginia where a white nationalist rally recently took place. What motivated the students?
The Black Lives Matter of William and Mary student group wrote on their Facebook page, where they live-streamed their shut down of the event: “We want to reaffirm our position of zero tolerance for white supremacy no matter what form it decides to masquerade in.” From these students’ perspective, the ACLU supporting someone’s right to say racist things was as bad as being a racist organization.
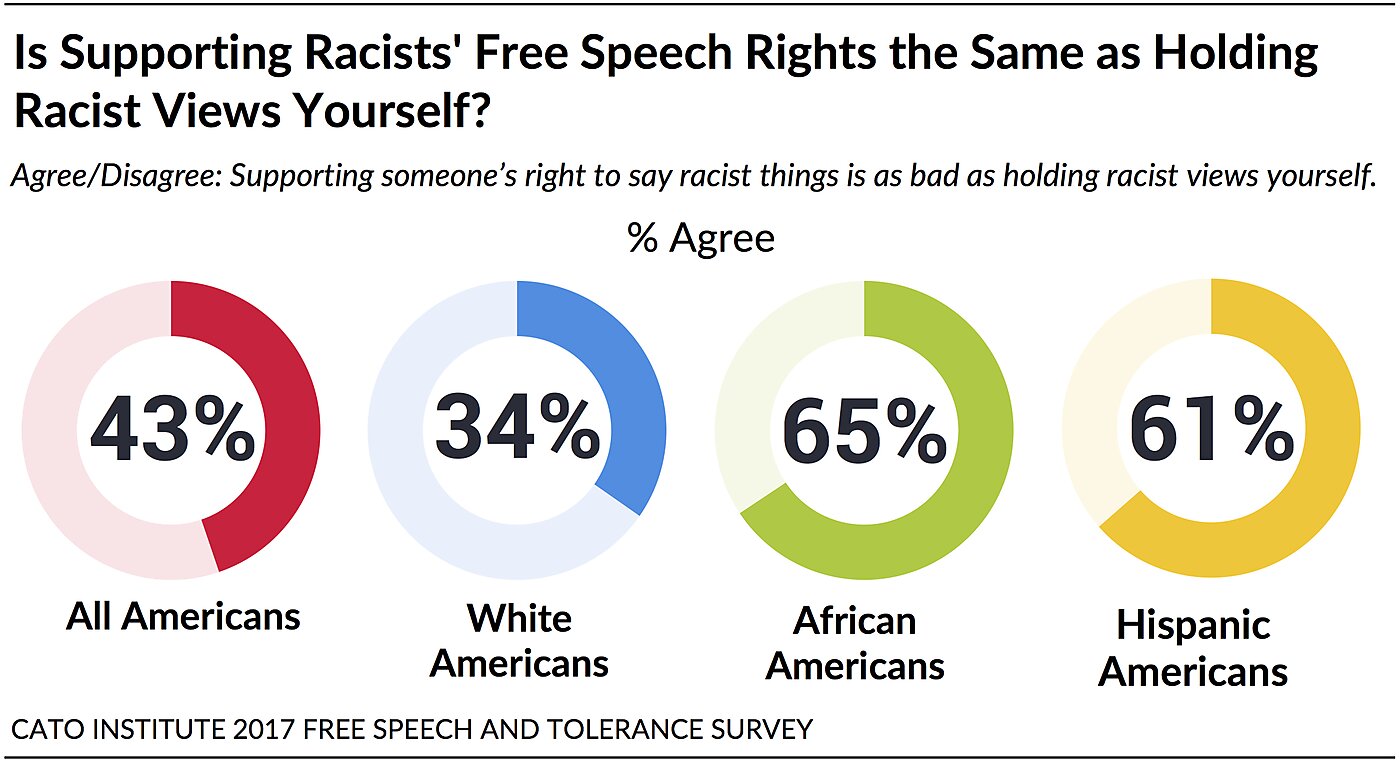
The Cato 2017 Free Speech and Tolerance Survey helps shed light on these students’ reasoning. First, nearly half (49%) of current college and graduate students believe that “supporting someone’s right to say racist things is as bad as holding racist views yourself.” This share rises to nearly two-thirds among African Americans (65%) and Latinos (61%) who agree. Far fewer white Americans (34%) share this view.
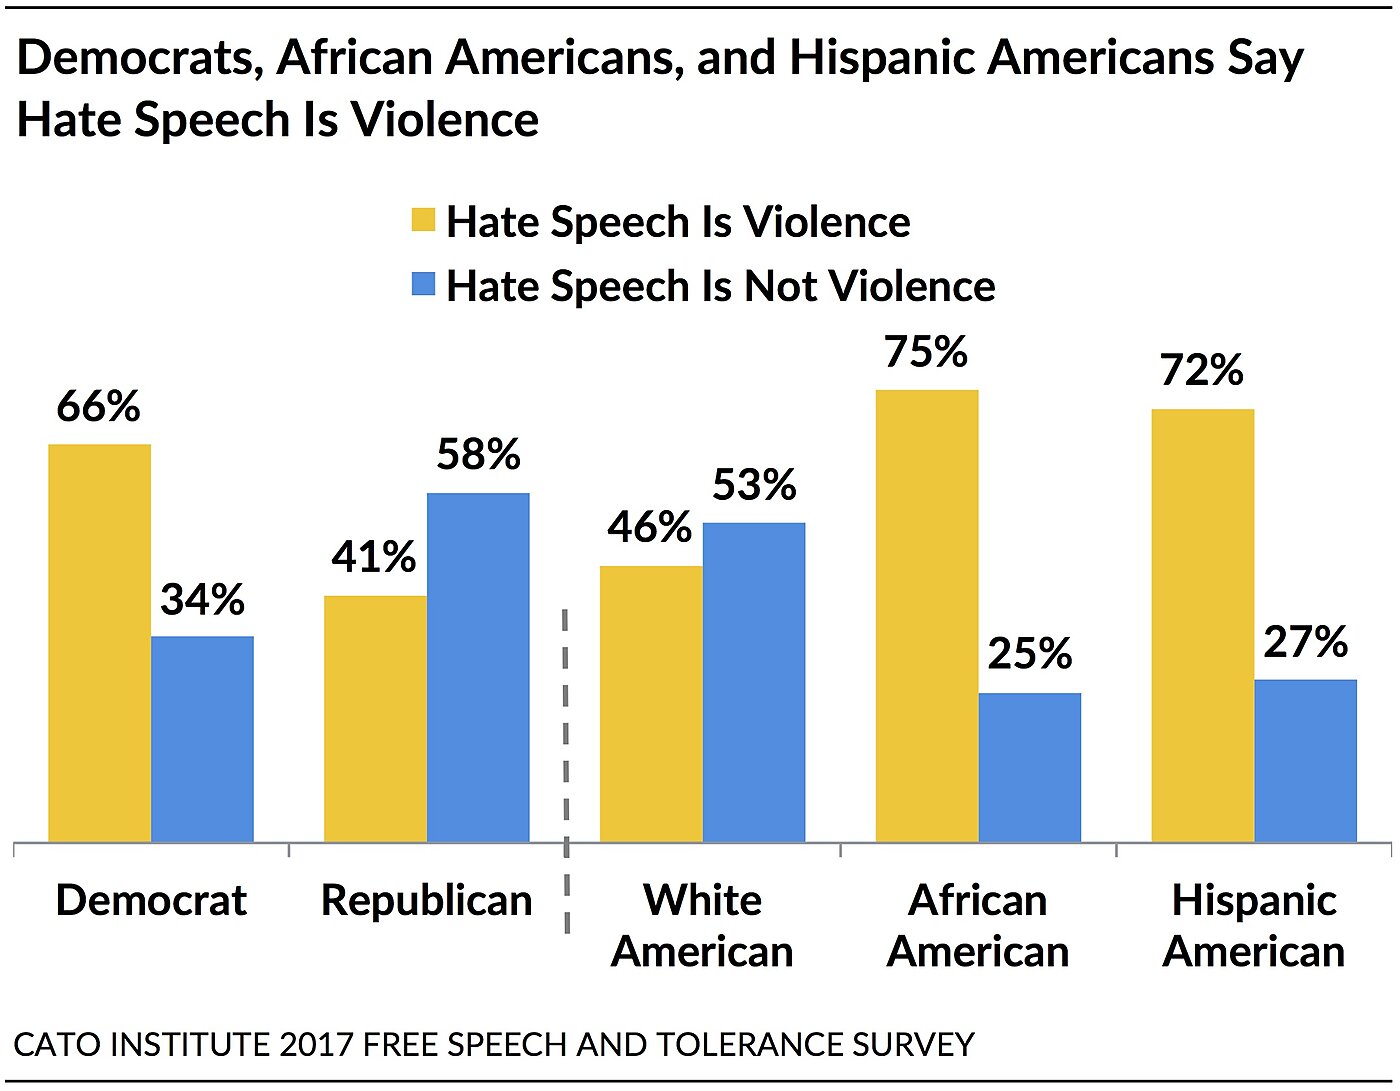
Next, a majority (55%) of current students and nearly three-fourths of African Americans (75%) and Latinos (72%) believe that hate speech is an act of violence. Conversely, 53% of whites believe it is not.
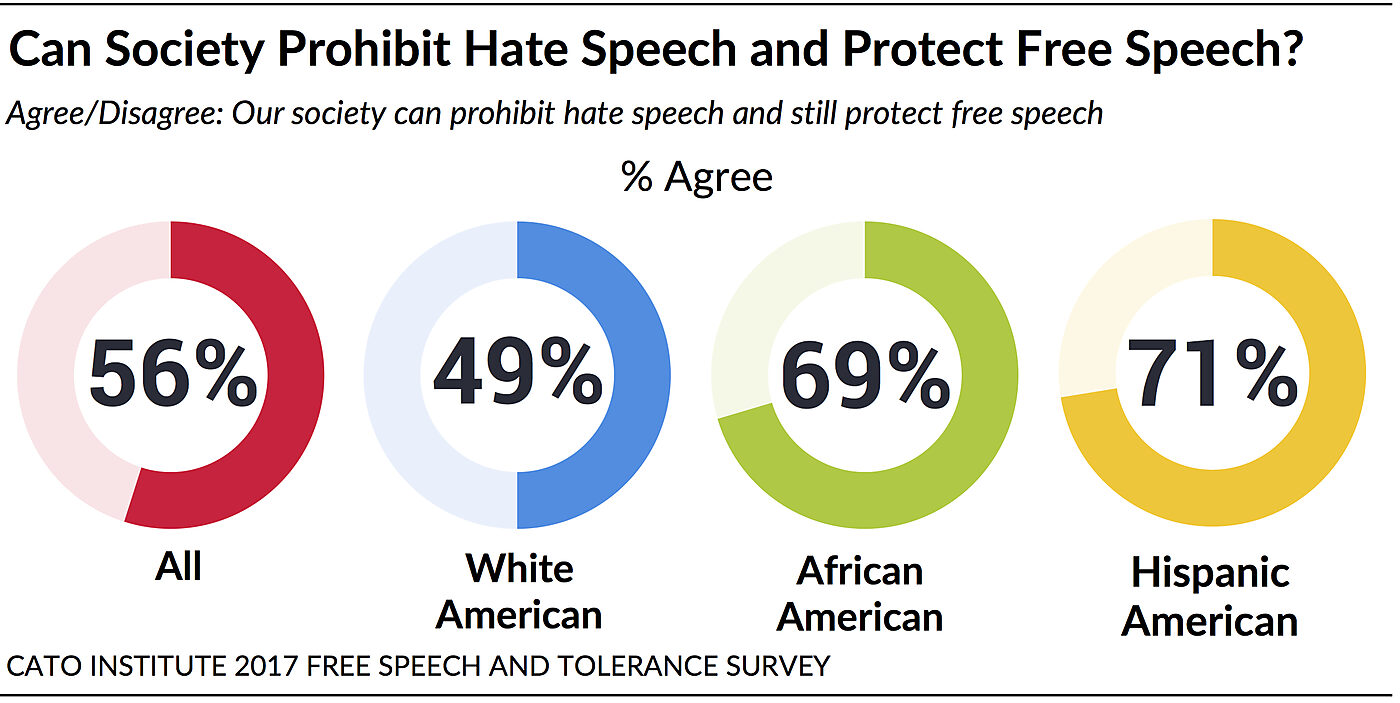
In addition, 62% of current students and 7 in 10 African Americans and Latinos believe that “our society can prohibit hate speech and still protect free speech.” White Americans are evenly divided on this question.
Taking these results together, it becomes clearer why the William and Mary students reacted as they did. From the students’ perspective, society is capable of protecting our First Amendment rights and curbing hate speech. If that’s true, why protect hate speech? Next, they believe hate speech is itself a violent act. Why would one want to enable violence against others? Consequently, many may conclude that anyone who tries to protect another’s right to engage in hate speech has nefarious intentions or is at least as bad as those espousing the hate. According to this view, protecting hate speech seems unnecessary and damaging. Thus, such a defense of free speech does not appear to be grounded in principle but rather a lack of empathy or even malice.
Understanding the assumptions behind the students’ logic allows for a more productive conversation. For instance, one might ask these students: is it really true that society can simultaneously ban hate speech and protect free speech? If so, how does society decide what speech is hateful and thus should be banned? Additional results from the survey demonstrate that Americans cannot agree what speech is hateful and offensive, which would make it difficult to regulate. This raises the next question: if society can’t agree what speech should be off limits, who gets to decide what speech is hateful and should be banned?
Answers to these questions are complicated and demonstrate why efforts to censor and regulate speech and expression are significantly problematic.
Sign up here to receive forthcoming Cato Institute survey reports
The Cato Institute 2017 Free Speech and Tolerance Survey was designed and conducted by the Cato Institute in collaboration with YouGov. YouGov collected responses online August 15–23, 2017 from a national sample of 2,300 Americans 18 years of age and older. The margin of error for the survey is +/- 3.00 percentage points at the 95% level of confidence.
About Those Loopholes
When it comes to individual taxes, key Republican legislators seem to think “reform” is mainly about limiting or eliminating certain itemized deductions, rather than about raising revenue in ways that do the least damage to the economy (by minimizing tax distortions and disincentives).
This emphasis on curbing itemized deductions is often compared with the Tax Reform Act of 1986 (TRA86), which supposedly “paid for” cutting the top tax rate from 50% to 28% by slashing several itemized deductions. In reality, however, most extra revenue from repealing itemized deductions after 1986 was devoted to raising the standard deduction, leaving total deductions unchanged. This is apparent in the graph below, which shows total deductions – both itemized and standard – as a percentage of Adjusted Gross Income.
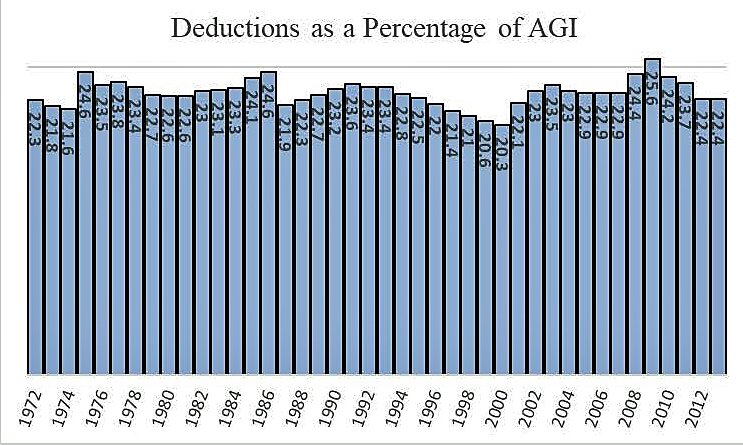
Deductions averaged 23.1% of AGI from 1976 to 1984, and deductions also averaged 23.1% of AGI from 1989 to 1995. In between, the reform merely shifted the timing of deductions. Deductions were pushed forward into 1985–86 to take advantage of those that were about to expire (e.g., the tax-deduction for credit card interest). Moving deductions forward held down deductions briefly in 1987–88 before they climbed back up again.
Note that total deductions were also unaffected by the fact that the maximum marginal benefit of itemized deductions (the amount saved per dollar) had fallen to 28–31% from 1988 to 1992. President Obama proposed to limit itemized deductions to 28% of the amount spent, but we already tried that in 1988–90, without success. Whatever the effect of the 1986 law eliminating several itemized deductions, plus the deep reduction in the marginal tax benefit, both were overwhelmed by the larger standard deduction.
Standard deductions doubled – from $151 billion in 1986 to over $309 billion in 1989. The only reason that is called “reform” is that politicians only define itemized deductions as “loopholes,” although the standard deduction obviously has the same effect on taxable income. Tax exemption and tax credits are far more valuable than deductions, yet (like the standard deduction) are commonly not described as “loopholes” as a matter of semantic convention (or confusion).
If the standard deduction soon rises to $24,000 per couple, as the GOP proposes, even couples with a $100,000 income would automatically have higher than average deductions.
The graph also shows that the ratio of deductions to income is clearly cyclical – rising in recessions like 1975 and 2009 because income fell more than deductions, then falling during the 1997–2000 stock boom as incomes (including capital gains and stock options) grew faster than deductions.
Reynolds’ Law of Taxes says the individual income tax will always hover around 8% of GDP, give or take one percentage point, regardless whether the top tax rate is 28%, 39.6%, 70% or 92%. Now, let’s add Reynolds’ Law of Deductions: Deductions will always hover around 23% of AGI, give or take one percentage point, regardless of whether itemized deductions are expanded, limited, or repealed.
Laws to limit itemized deductions, unlike booms and busts, have never had a noticeable lasting impact, largely because of Congressional fondness for raising standard deductions (and refundable tax credits, a super-loophole not counted here).
The Bush 41 Pease limitation on deductions was an anti-affluence political stunt making little noticeable difference. Revived in 2013, the Pease limits reduce the value of a taxpayer’s itemized deductions by 3% for every dollar of taxable income above $313,800 on a joint return. This adds about a percentage point to the top two marginal rates (and so does the PEP phase-out of personal exemptions). The Pease limits first began to phase-out itemized deductions of “the rich” in 1991, yet total deductions rose to 23.4–23.6% of AGI in 1991–93. The Pease phase-out was reinstated in 2013, yet total deductions remained the same as in 2012. Itemized deductions went down by $50.1 billion in 2013 and standard deductions went up $51.2 billion.
Doubling the standard deduction to $24,000 per couple appeared to be the primary revenue-losing objective of the GOP Big Six plan (losing $890 billion over 10 years by one estimate). Meanwhile, there have been reports of backpaddling on trial-balloons about ending property tax deductions and curbing contributions to 401(k) plans. It is not difficult to imagine the end result being that any revenue gained from limiting deductions barely offsets revenue lost by expanding the standard deduction, leaving deductions still stuck around 22–23% of AGI.
That would be like 1986 but with one big difference. In 1986, the top tax rate was cut by 22 percentage points, leaving a nearly-flat 15–28% rate structure. This year, by contrast, high-income taxpayers are not giving up big deductions and personal exemptions for a lower-rate, since the top rate is apparently to stay at 39.6%. Itemized deductions go down, personal exemptions completely vanish, yet targeted tax credits get larger (e.g., for children under age 17) and the standard deduction goes up. Tax-deferred contributions to retirement savings plans may be deeply slashed.
By rejiggering exemptions, deductions, and credits with essentially no change in the highest, most damaging tax rates, the individual side of the Republican “tax cut” is shaping up as a sizable tax increase for well-educated two-earner couples with college-age kids living in high-cost metropolitan areas, among others.
Related Tags
63% of Republicans Say Journalists Are an “Enemy of the American People”

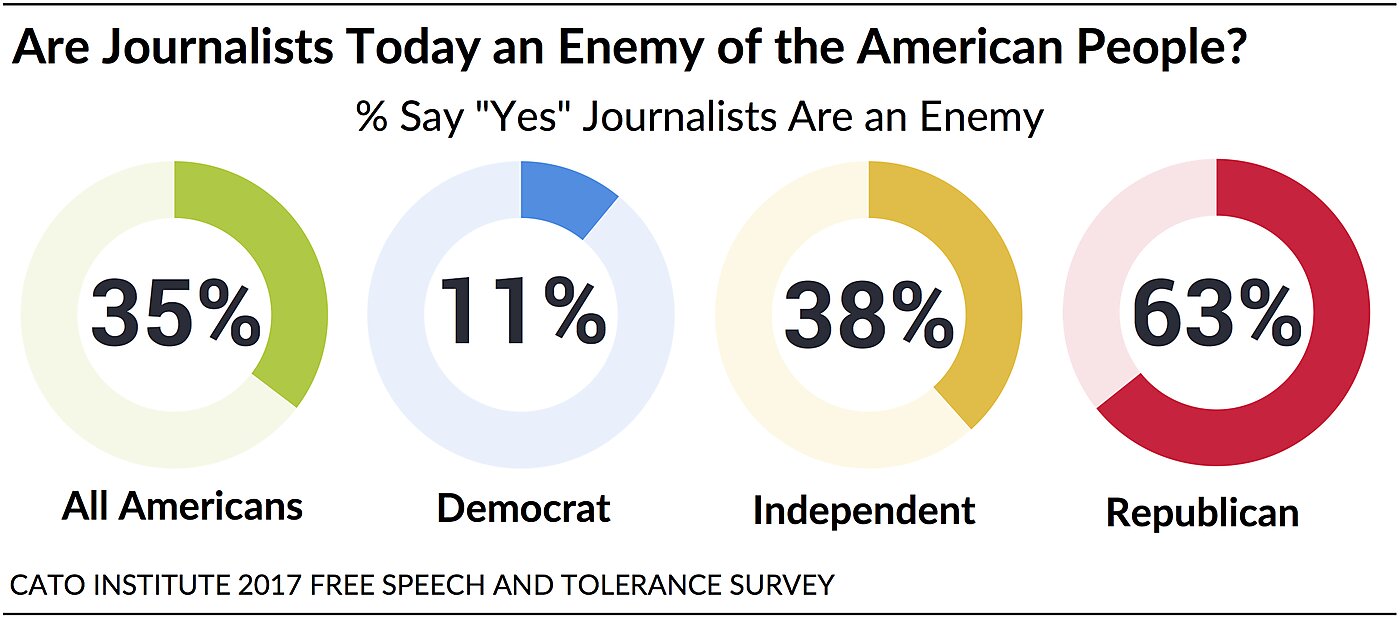
Early in his presidential tenure, Donald Trump tweeted that the national news media is “fake news” and that it is an enemy of the American people. Nearly two-thirds (64%) of Americans do not agree with President Trump that journalists today are an “enemy of the American people,” finds the Cato 2017 Free Speech and Tolerance Survey. Thirty-five percent (35%) side with the president.
However, nearly two-thirds (63%) of Republicans agree that journalists are an enemy of the American people. Such a charge is highly polarizing: 89% of Democrats and 61% of independents do not think journalists are the enemy.
52% of Democrats Say Media Is Doing a Good Job Holding Government Accountable
While Republicans stand out with their negative view of the media, Democrats have uniquely positive evaluations of it. A slim majority (52%) of Democrats say the national news media is doing a good or even an excellent job “holding government accountable.” In contrast, only 24% of independents and 16% of Republicans agree.
Full survey results and report found here.
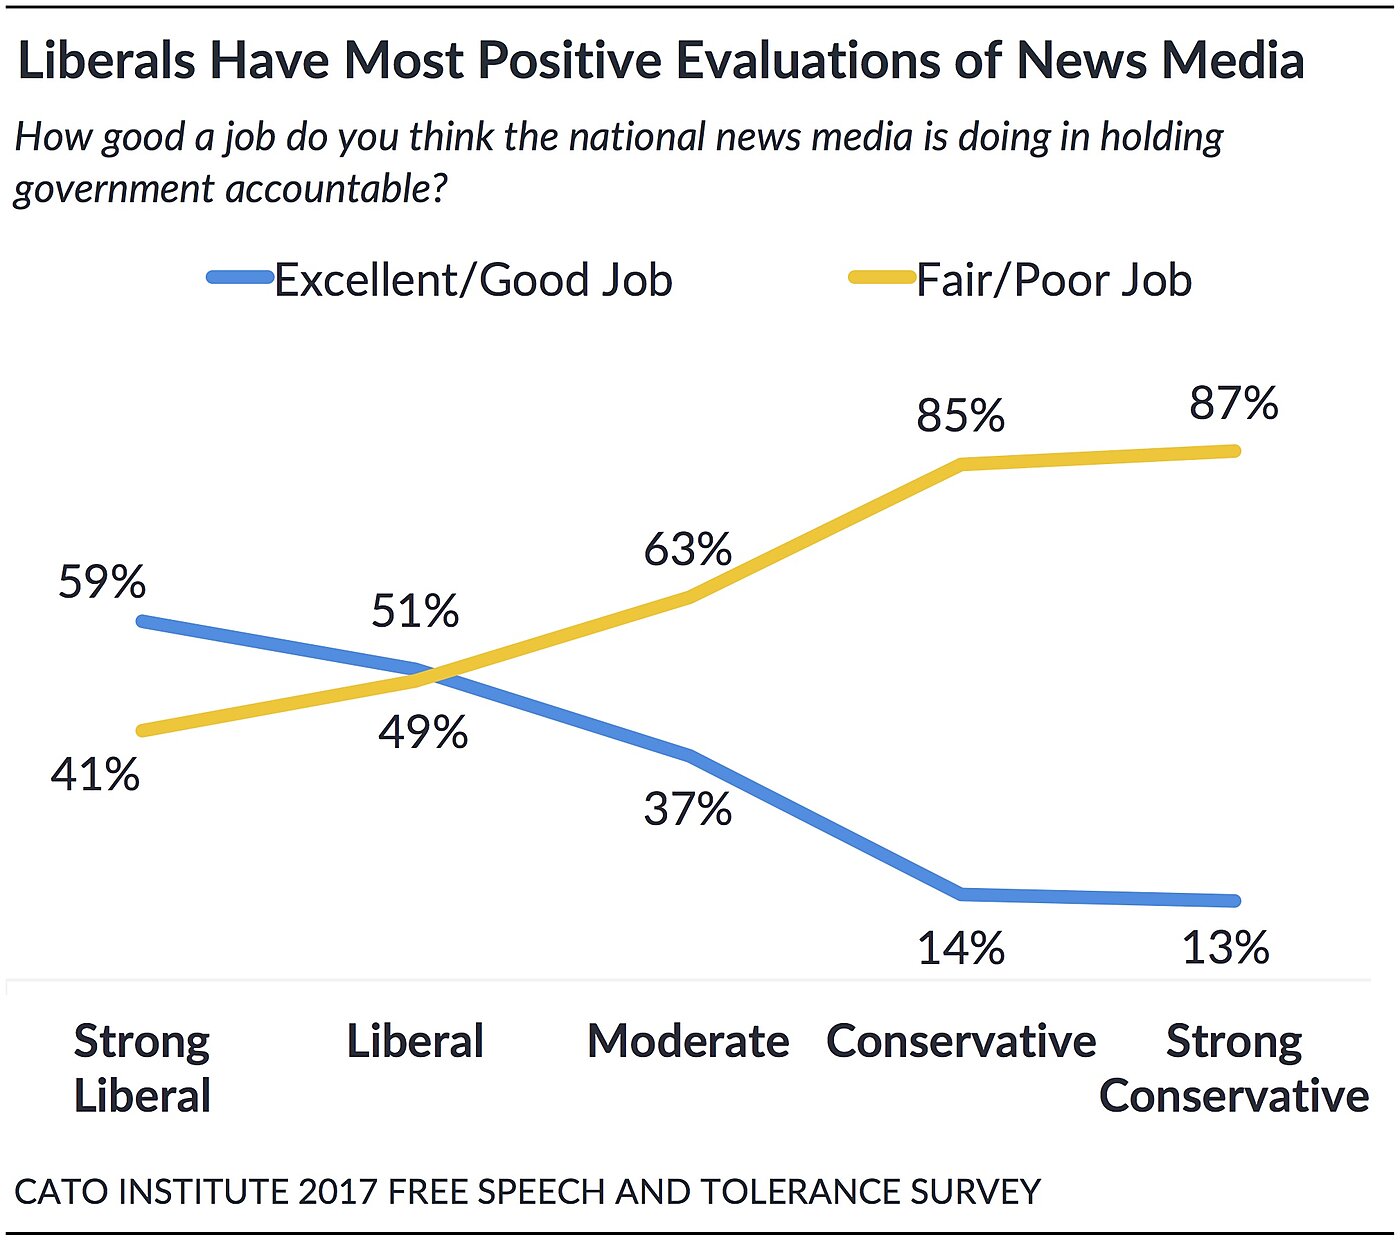
Among all Americans, only a third (33%) agree the news media is doing its job holding government accountable. More than two-thirds (67%) say it is not.
The more a person identifies as liberal, the more likely they are to say the media is doing a good job. Among strong liberals, 59% say the national news media is doing a good or excellent job holding government accountable. In contrast, 87% of strong conservatives say it’s doing a poor or fair job.
Most Americans Perceive Media Bias
Why do Republicans lack confidence in the national news media while Democrats view it positively? Perhaps because most Americans perceive a liberal bias among most major news organizations.[1]
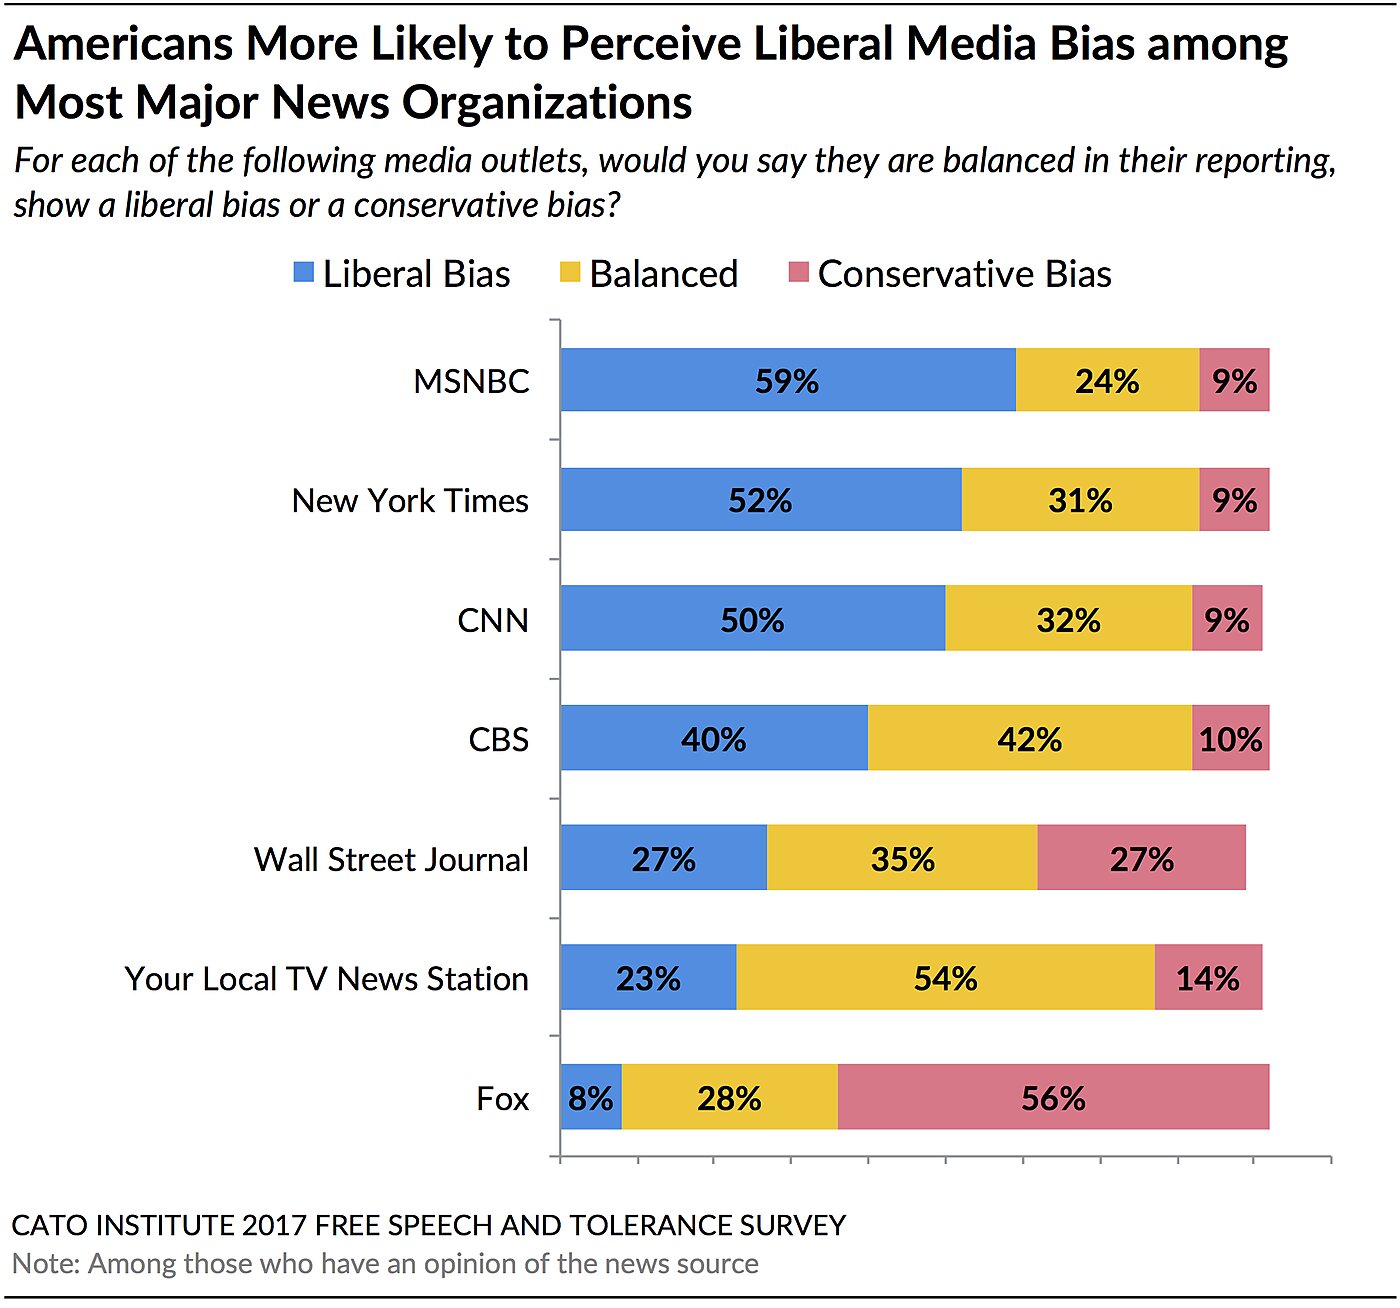
Fifty-two percent (52%) of respondents say that the New York Times allows a liberal bias to color its reporting. Fifty percent (50%) feel CNN also succumbs to a liberal media bias. Fifty-nine percent (59%) say that MSNBC also has a liberal bias. Of all the top news organizations included on the survey, only Fox News was perceived to have a conservative bias (56%).
Americans feel their local news stations and broadcast news channels do a better job than cable news in providing balanced reporting. A majority (54%) say their local news station is balanced, without a liberal or a conservative bias. A plurality (42%) also believe that CBS is balanced. Nevertheless, respondents were four times as likely to say CBS has a liberal bias than a conservative bias (40% vs. 10%), and almost twice as likely to say their local station has a liberal bias (23% vs. 14%).
Democrats Believe Media Is Balanced; Republicans See Liberal Bias
Majorities of Democrats believe most major news organizations are balanced in their reporting, including CBS (72%), CNN (55%), the New York Times (55%), as well as their local news station (67%). A plurality (44%) also believe the Wall Street Journal is balanced. The two exceptions are that a plurality (47%) believe MSNBC has a liberal bias (37% believe it’s unbiased) and a strong majority (71%) say Fox has a conservative bias.
Republicans, on the other hand, see things differently. Overwhelming majorities believe liberal bias colors reporting at the New York Times (80%), CNN (81%), CBS (73%), and MSNBC (80%). A plurality also feel the Wall Street Journal (48%) has a liberal tilt. Only when evaluating their local TV news station do most Republicans—but not a majority—perceive balanced reporting (42%). Similar to Democrats’ perceptions of MSNBC, a plurality of Republicans (44%) believe Fox News has a conservative bias; 41% believe it provides unbiased reporting.
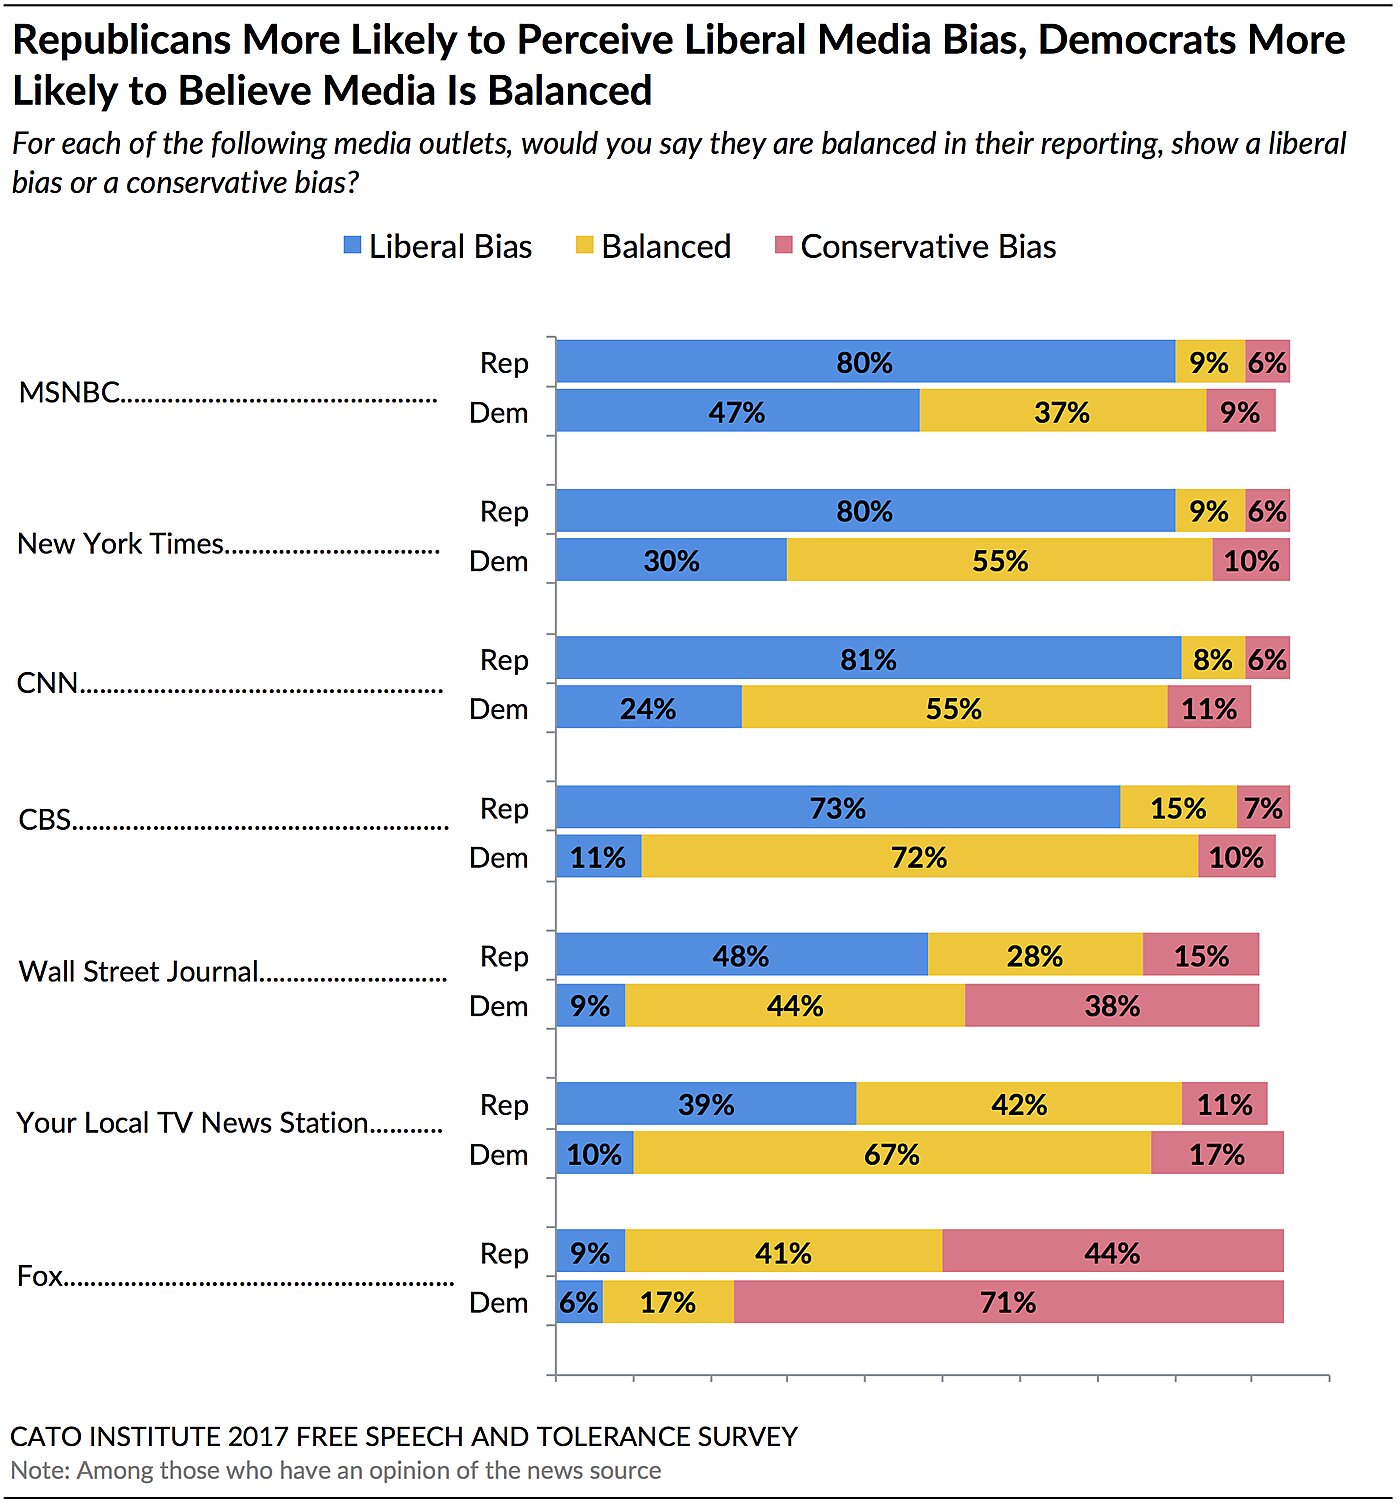
The news outlets that Republicans find most objective are their local news station (42%), Fox (41%), and the Wall Street Journal (28%). The media organizations Democrats find most objective include CBS (72%), their local news station (67%), CNN (55%), and the New York Times (55%).
70% Say Government Should Not Be Able to Shut Down News Stories
Despite Democrats and Republicans’ different perceptions of news media, they agree that government should not shut down news stories—even if biased or inaccurate.
Strong majorities of Republicans (63%), independents (71%), and Democrats (76%) agree that “government should not be able to stop a news media outlet from publishing a story that government officials say is biased or inaccurate.”
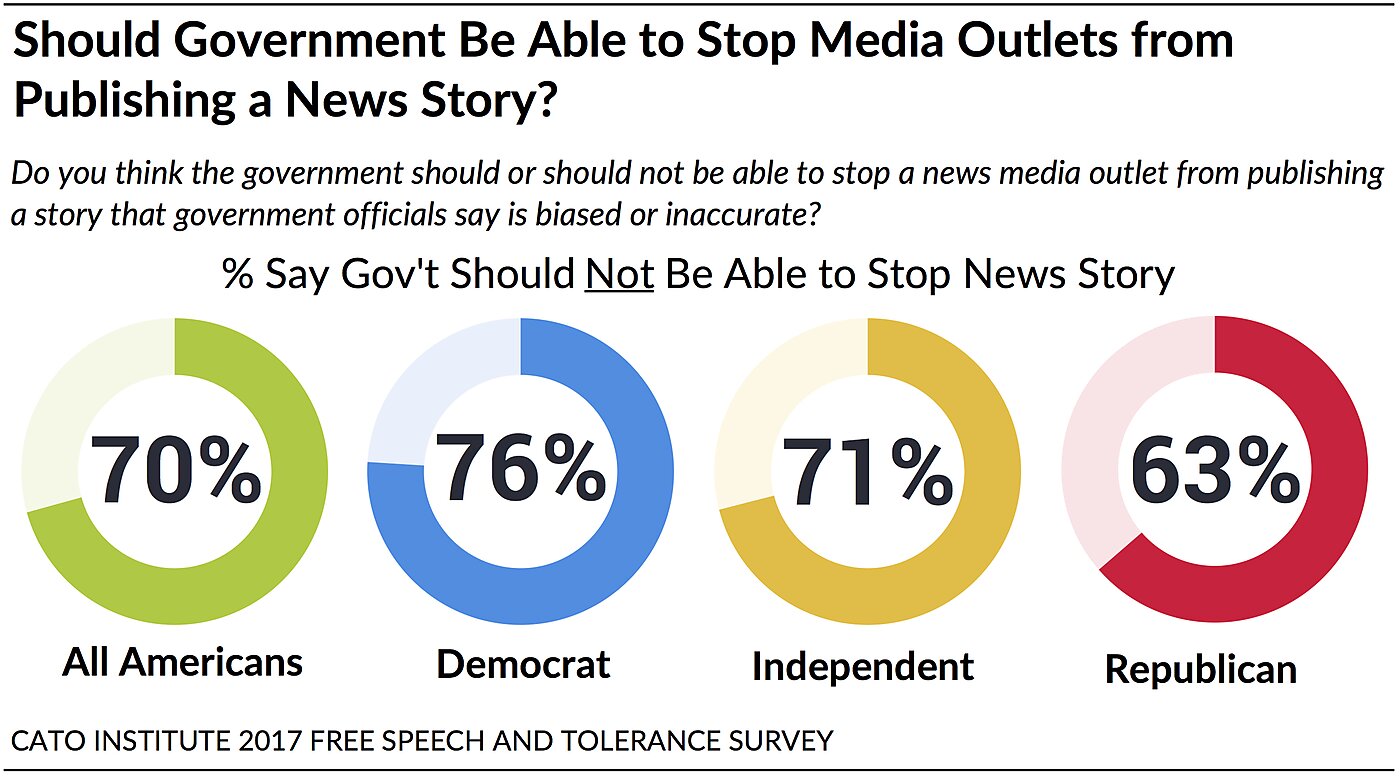
Among all Americans, 70% say government should not shut down news stories regardless of whether officials think the story is inaccurate. A little more than a quarter (29%) think government should have the authority to stifle stories authorities say are inaccurate or biased.
Full survey results and report found here.
Sign up here to receive forthcoming Cato Institute survey reports
The Cato Institute 2017 Free Speech and Tolerance Survey was designed and conducted by the Cato Institute in collaboration with YouGov. YouGov collected responses online August 15–23, 2017 from a national sample of 2,300 Americans 18 years of age and older. The margin of error for the survey is +/- 3.00 percentage points at the 95% level of confidence.
[1] Percentages in this section have been calculated among Americans with an opinion of the news source. The following were not familiar with each of these news sources: CNN: 16%, Fox: 13%, MSNBC: 22%, CBS: 19%, Local TV News Station: 18%, New York Times: 24%, Wall Street Journal: 29%.
Poll: 71% of Americans Say Political Correctness Has Silenced Discussions Society Needs to Have, 58% Have Political Views They’re Afraid to Share

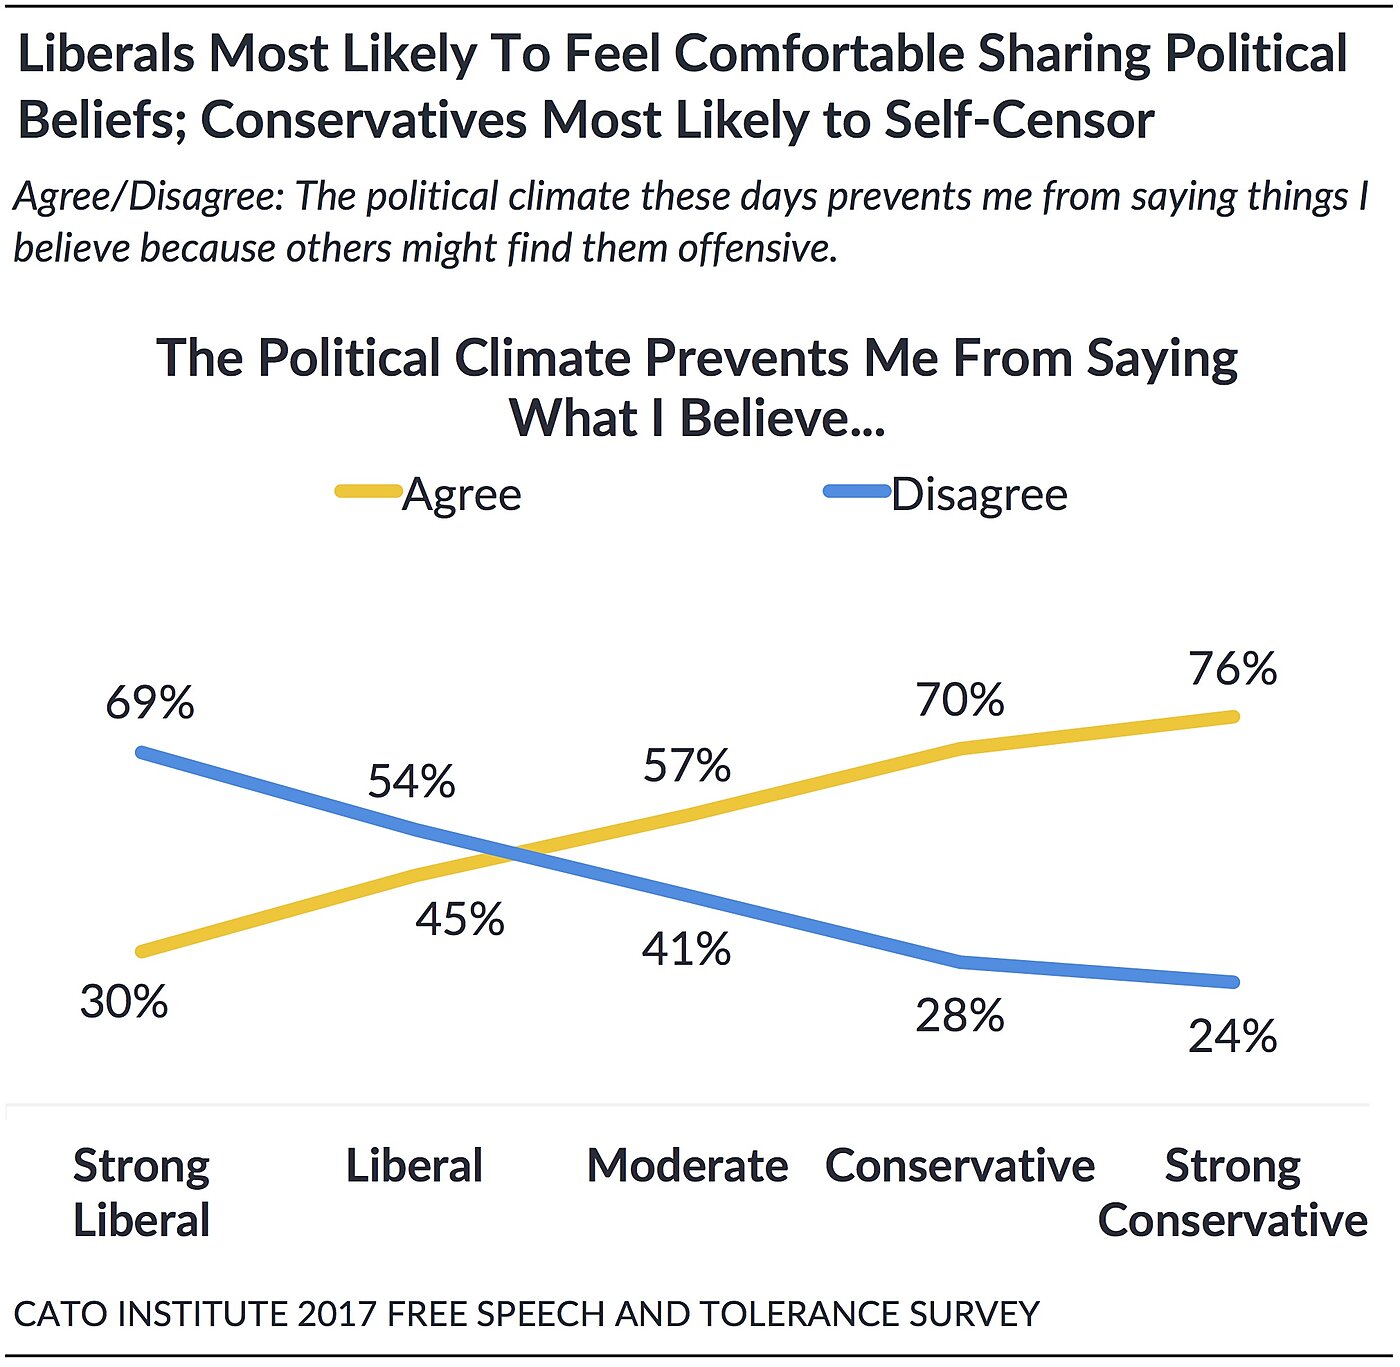
The Cato 2017 Free Speech and Tolerance Survey, a new national poll of 2,300 U.S. adults, finds that 71% Americans believe that political correctness has silenced important discussions our society needs to have. The consequences are personal—58% of Americans believe the political climate prevents them from sharing their own political beliefs.
Democrats are unique, however, in that a slim majority (53%) do not feel the need to self-censor. Conversely, strong majorities of Republicans (73%) and independents (58%) say they keep some political beliefs to themselves.
Full survey results and report found here.
It follows that a solid majority (59%) of Americans think people should be allowed to express unpopular opinions in public, even those deeply offensive to others. On the other hand, 40% think government should prevent hate speech. Despite this, the survey also found Americans willing to censor, regulate, or punish a wide variety of speech and expression they personally find offensive:
- 51% of staunch liberals say it’s “morally acceptable” to punch Nazis.
- 53% of Republicans favor stripping U.S. citizenship from people who burn the American flag.
- 51% of Democrats support a law that requires Americans use transgender people’s preferred gender pronouns.
- 65% of Republicans say NFL players should be fired if they refuse to stand for the anthem.
- 58% of Democrats say employers should punish employees for offensive Facebook posts.
- 47% of Republicans favor bans on building new mosques.
Americans also can’t agree what speech is hateful, offensive, or simply a political opinion:
- 59% of liberals say it’s hate speech to say transgender people have a mental disorder; only 17% of conservatives agree.
- 39% of conservatives believe it’s hate speech to say the police are racist; only 17% of liberals agree.
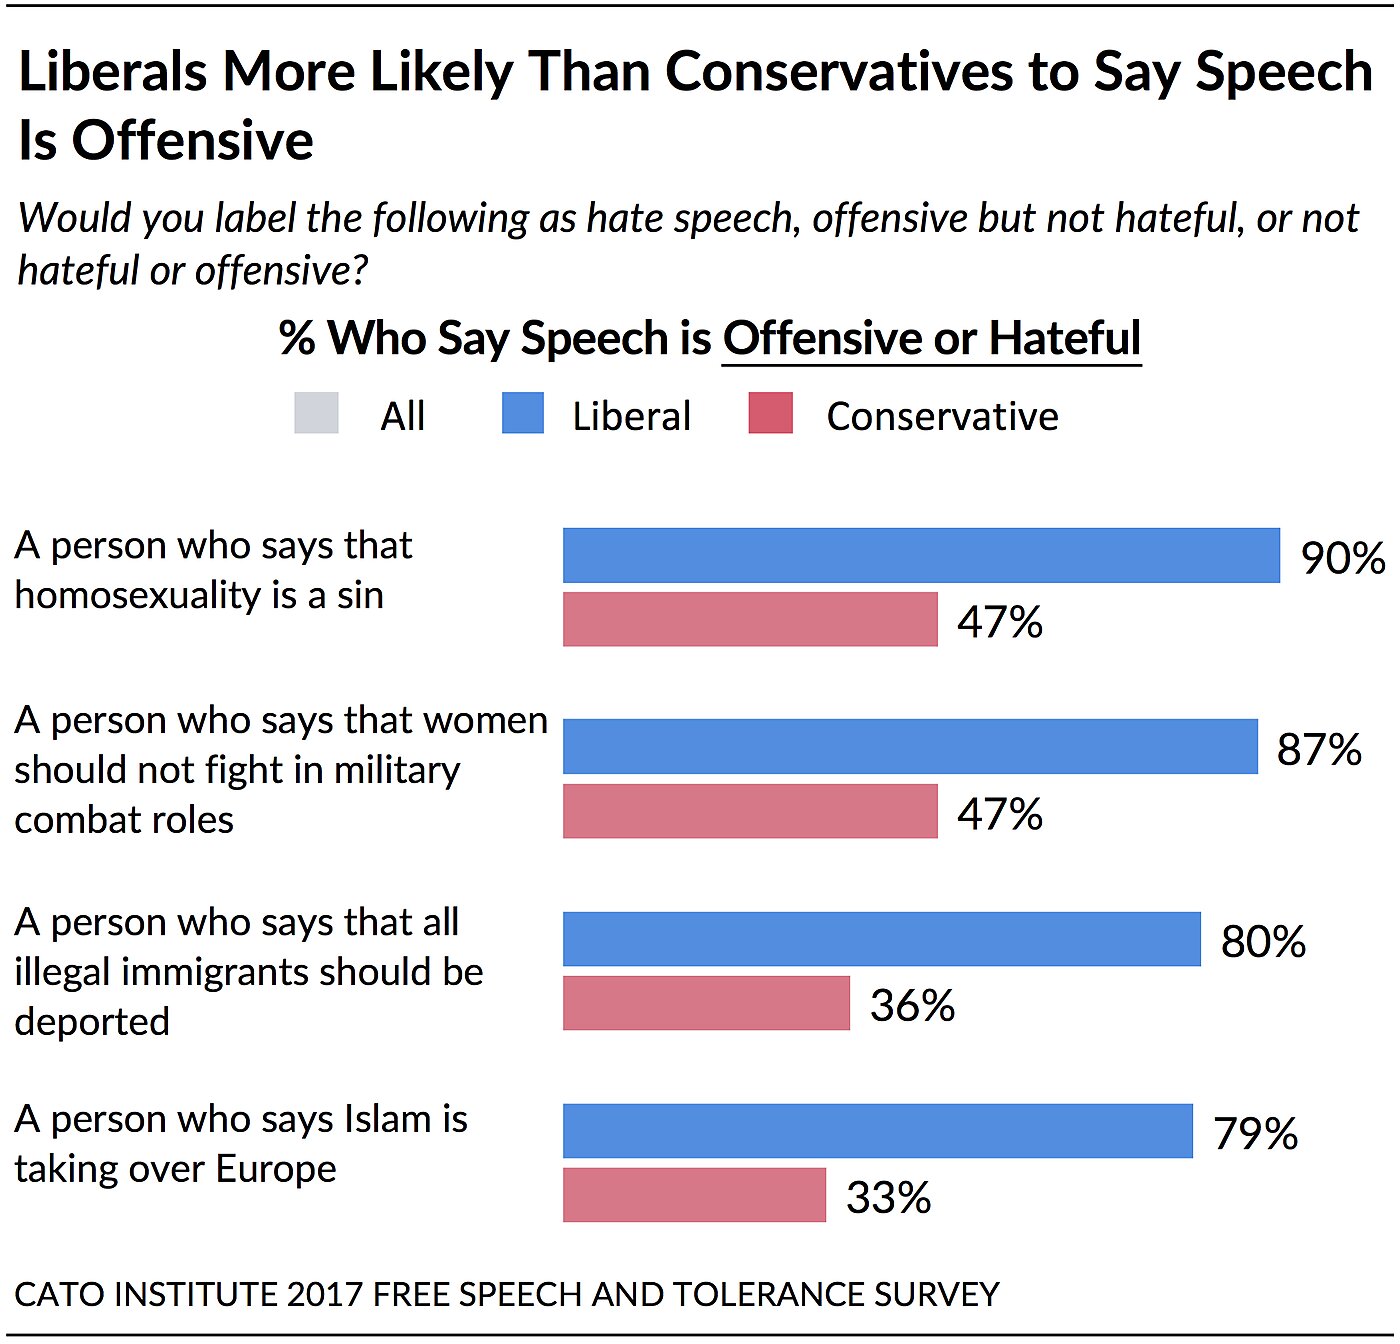
- 80% of liberals say it’s hateful or offensive to say illegal immigrants should be deported; only 36% of conservatives agree.
- 87% of liberals say it’s hateful or offensive to say women shouldn’t fight in military combat roles, while 47% of conservatives agree.
- 90% of liberals say it’s hateful or offensive to say homosexuality is a sin, while 47% of conservatives agree.
Americans Oppose Hate Speech Bans, But Say Hate Speech is Morally Unacceptable
Although Americans oppose (59%) outright bans on public hate speech, that doesn’t mean they think hate speech is acceptable. An overwhelming majority (79%) say it’s “morally unacceptable” to say offensive things about racial or religious groups.

Black, Hispanic, and White Americans Disagree about How Free Speech Operates
African Americans and Hispanics are more likely than white Americans to believe:
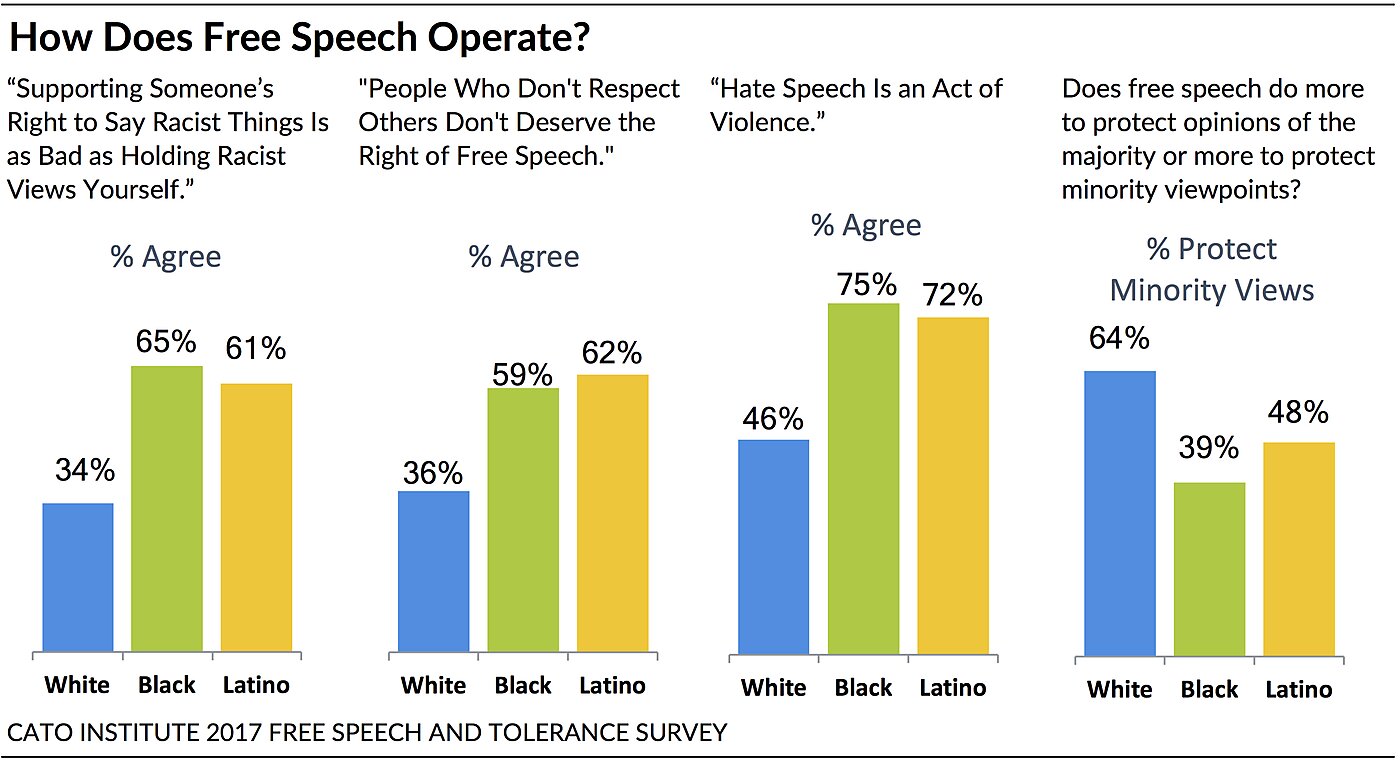
- Free speech does more to protect majority opinions, not minority viewpoints (59%, 49%, 34%).
- Supporting someone’s right to say racist things is as bad as holding racist views yourself (65%, 61%, 34%).
- People who don’t respect others don’t deserve the right of free speech (59%, 62%, 36%).
- Hate speech is an act of violence (75%, 72%, 46%).
- Our society can prohibit hate speech and still protect free speech (69%, 71%, 49%).
- People usually have bad intentions when they express offensive opinions (70%, 75%, 52%).
However, black, Hispanic, and white Americans agree that free speech ensures the truth will ultimately prevail (68%, 70%, 66%). Majorities also agree that it would be difficult to ban hate speech since people can’t agree what hate speech is (59%, 77%, 87%).
Two-Thirds Say Colleges Aren’t Doing Enough to Teach the Value of Free Speech
Two-thirds of Americans (66%) say colleges and universities aren’t doing enough to teach young Americans today about the value of free speech. When asked which is more important, 65% say colleges should expose students to “all types of viewpoints even if they are offensive or biased against certain groups.” About a third (34%) say colleges should “prohibit offensive speech that is biased against certain groups.”
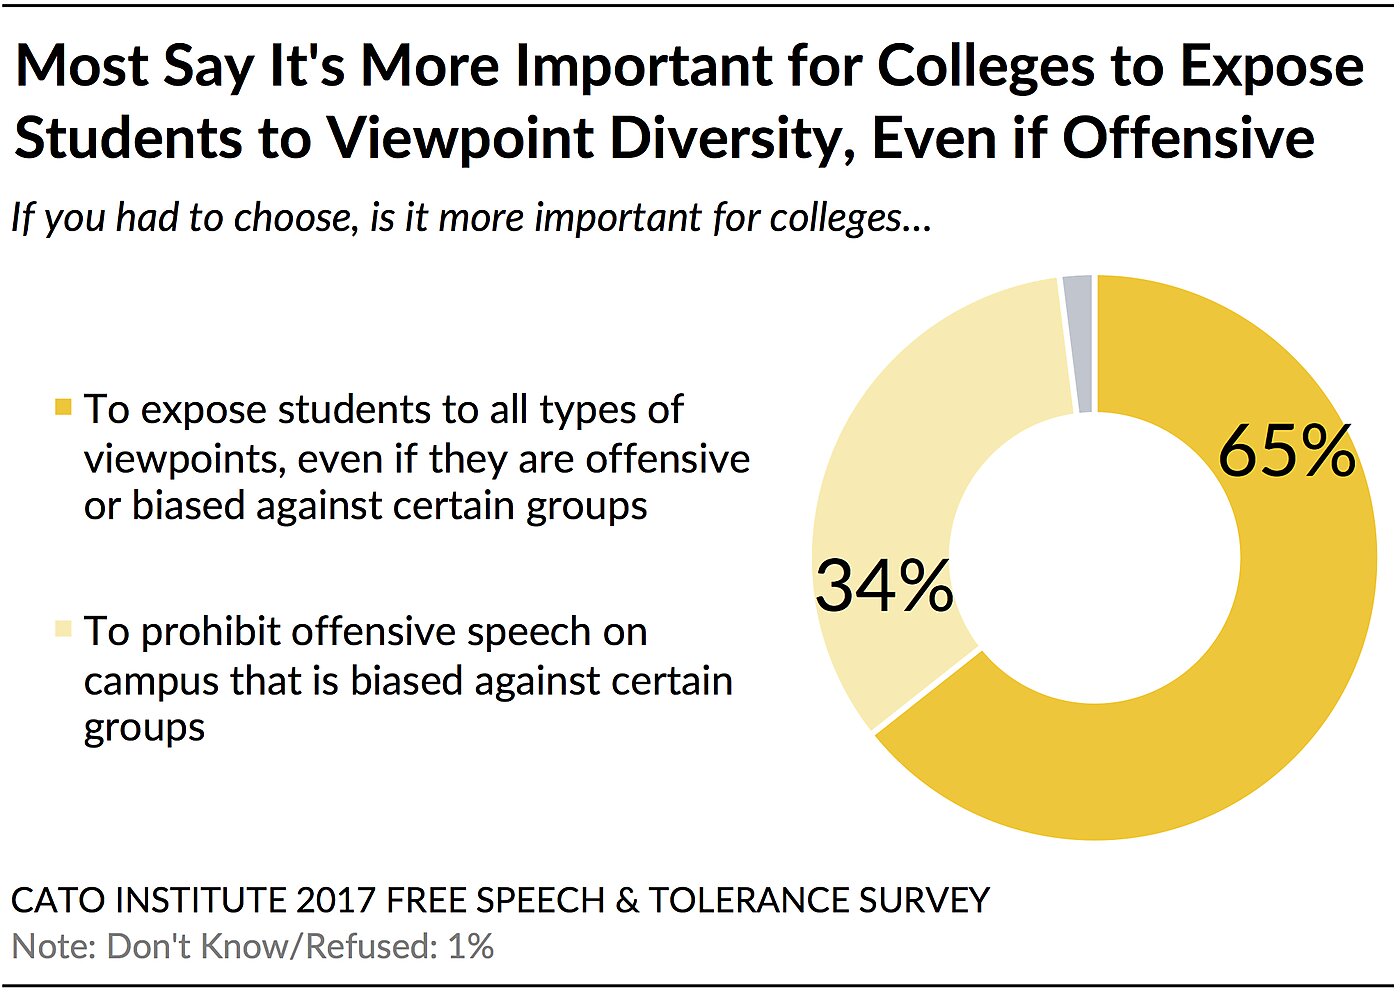
But Americans are conflicted. Despite their desire for viewpoint diversity, a slim majority (53%) also agree that “colleges have an obligation to protect students from offensive speech and ideas that could create a difficult learning environment.” This share rises to 66% among Democrats; 57% of Republicans disagree.
76% Say Students Shutting Down Offensive Speakers Reveals “Broader Pattern” of How Students Cope
More than three-fourths (76%) of Americans say that recent campus protests and cancellations of controversial speakers are part of a “broader pattern” of how college students deal with offensive ideas. About a quarter (22%) think these protests and shutdowns are simply isolated incidents.
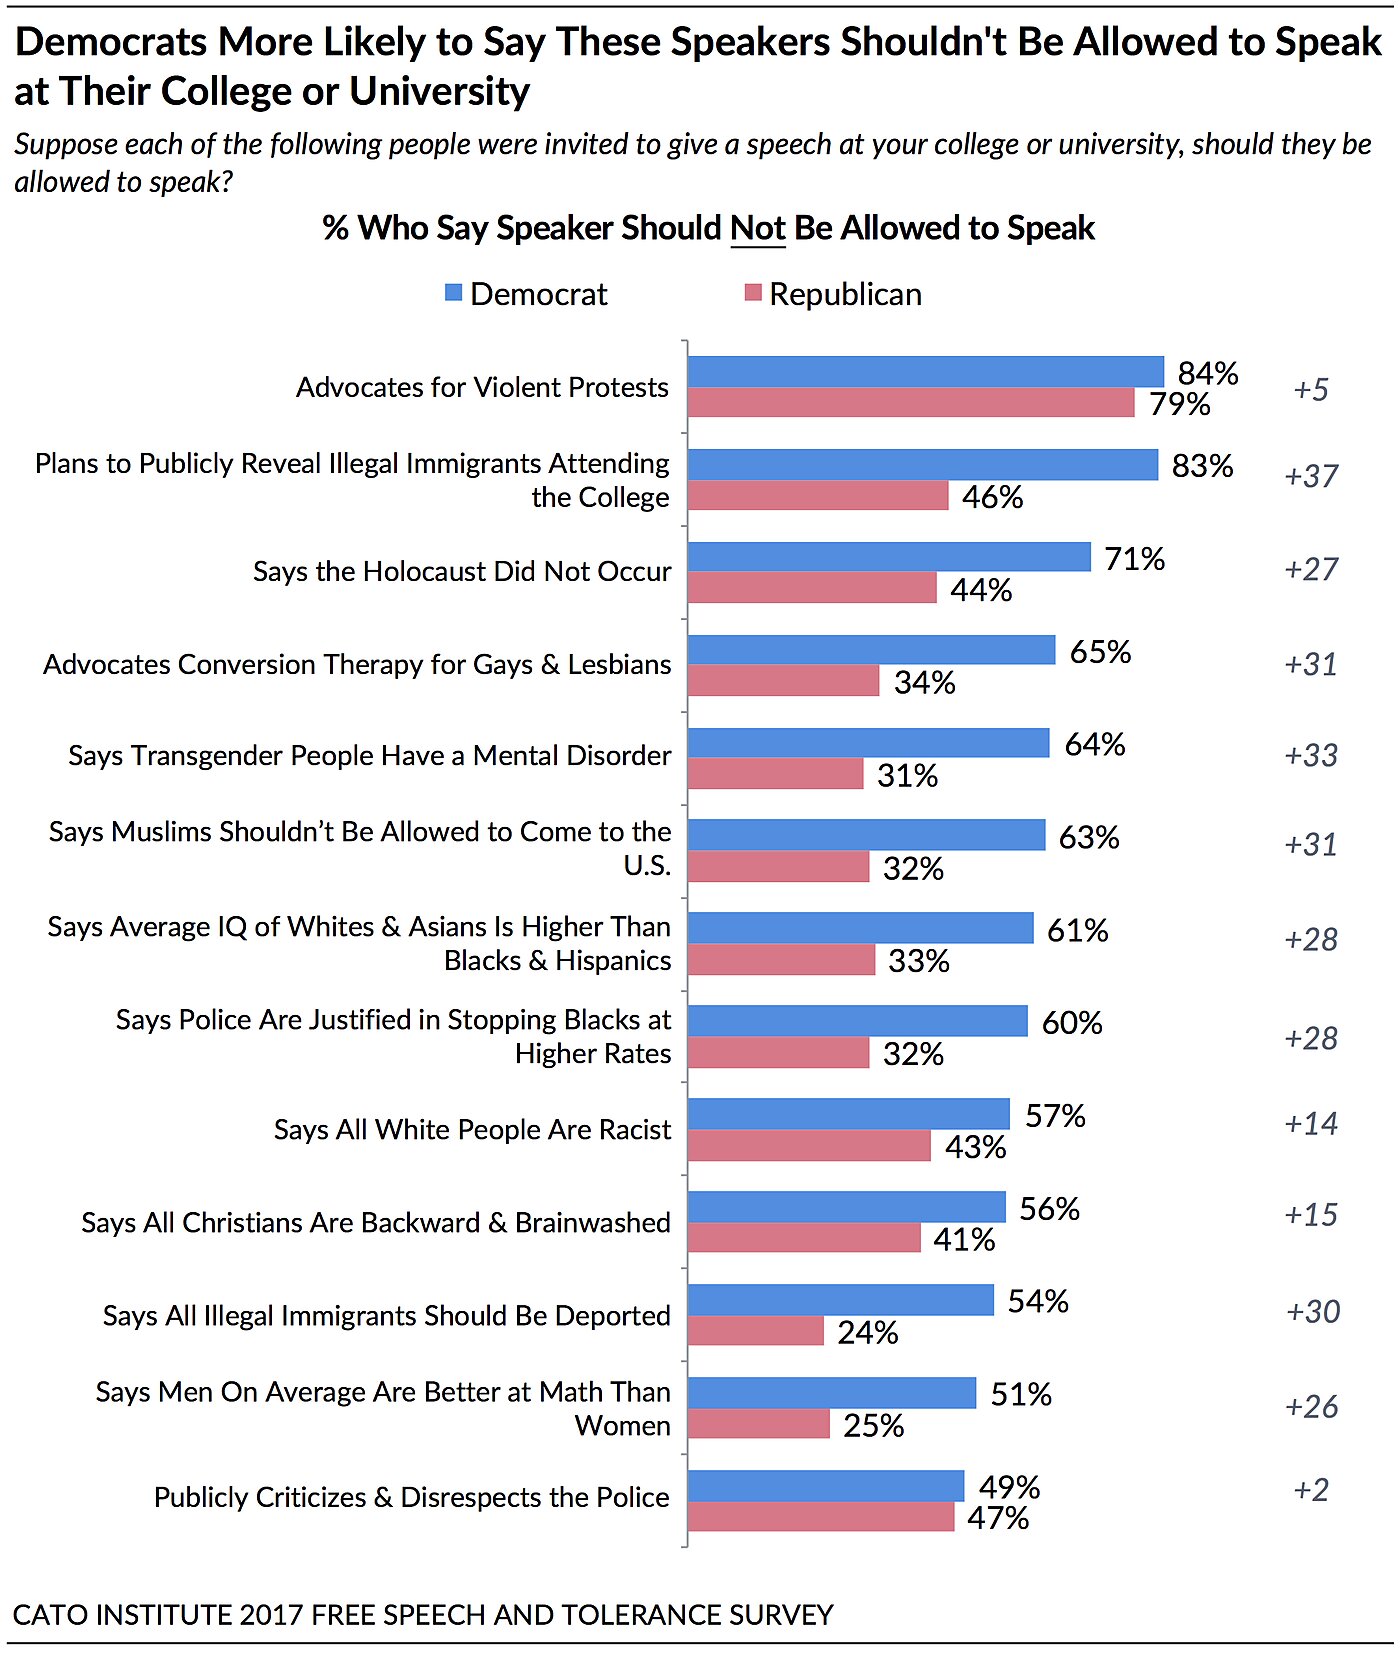
However, when asked about specific speakers, about half of Americans with college experience think a wide variety should not be allowed to speak at their college:
- A speaker who says that all white people are racist (51%)
- A speaker who says Muslims shouldn’t be allowed to come to the U.S. (50%)
- A speaker who says that transgender people have a mental disorder (50%)
- A speaker who publicly criticizes and disrespects the police (49%)
- A speaker who says all Christians are backwards and brainwashed (49%)
- A speaker who says the average IQ of whites and Asians is higher than African Americans and Hispanics (48%)
- A speaker who says the police are justified in stopping African Americans at higher rates than other groups (48%)
- A speaker who says all illegal immigrants should be deported (41%)
- A speaker who says men on average are better at math than women (40%)
Nevertheless, few endorse shutting down speakers by shouting loudly (4%) or forcing the speaker off the stage (3%). Current college and graduate students aren’t much different; only about 7% support forcibly shutting down offensive speakers.
65% Say Colleges Should Discipline Students Who Shut Down Invited Campus Speakers
Two-thirds (65%) say colleges need to discipline students who disrupt invited speakers and prevent them from speaking. However, the public is divided about how: 46% want to give students a warning, 31% want the incident noted on the student’s academic record, 22% want them to pay a fine, 20% want to suspend them, 19% favor arresting the students, 13% want to fully expel the students. Three-fourths (75%) of Republicans support some form of punishment for these students, compared to 42% of Democrats.

People of Color Don’t Find Most Microaggressions Offensive
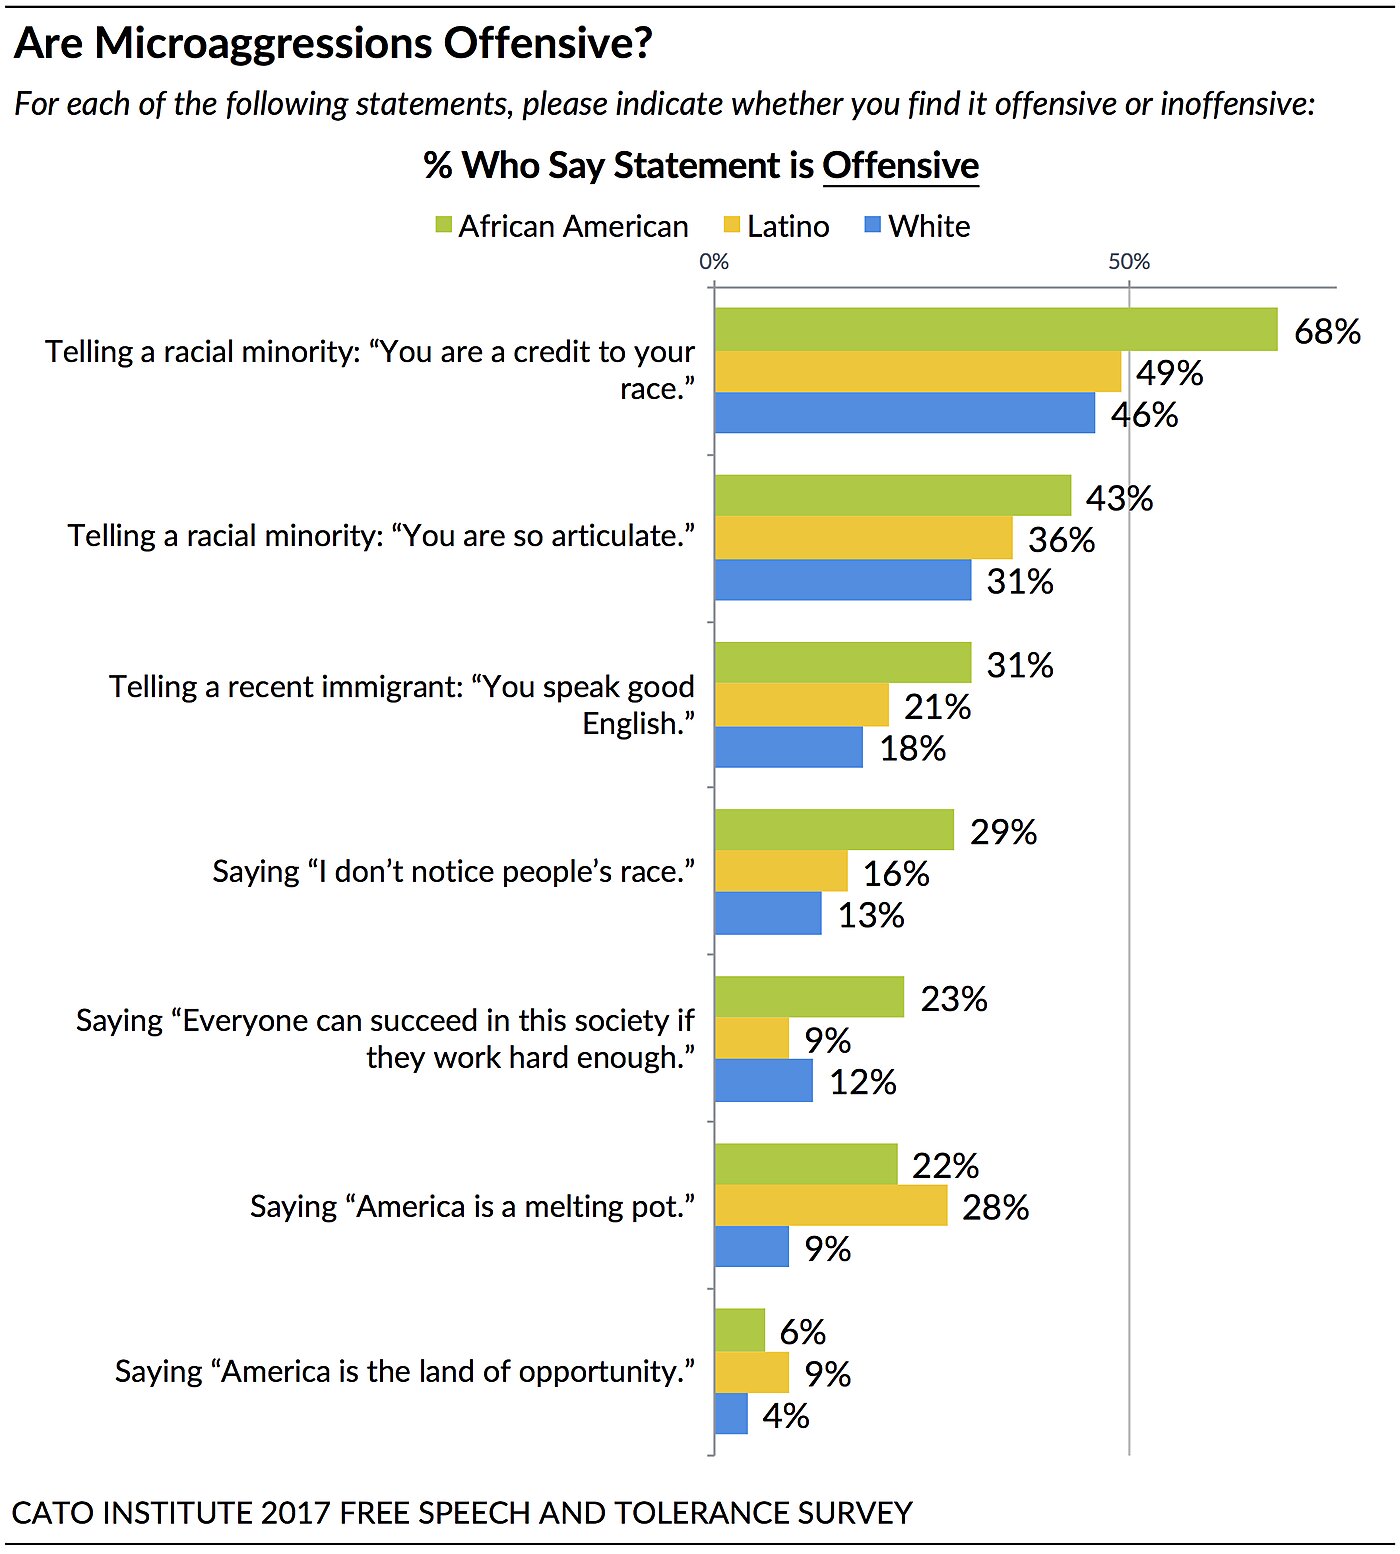
The survey finds that many microaggressions colleges and universities advise faculty and students to avoid aren’t considered offensive by most people of color. The percentage of African Americans and Latinos who say these microaggressions are not offensive are as follows:
- Telling a recent immigrant: “You speak good English” Black: 67% Latino: 77%
- Telling a racial minority: “You are so articulate” Black: 56% Latino: 63%
- Saying “I don’t notice people’s race” Black: 71% Latino: 80%
- Saying “America is a melting pot” Black: 77% Latino: 70%
- Saying “Everyone can succeed in this society if they work hard enough.” Black: 77% Latino: 89%
- Saying “America is the land of opportunity” Black: 93% Latino: 89%
The one microaggression that African Americans (68%) agree is offensive is telling a racial minority “you are a credit to your race.”
Americans Don’t Think Colleges Need to Advise Students on Halloween Costumes
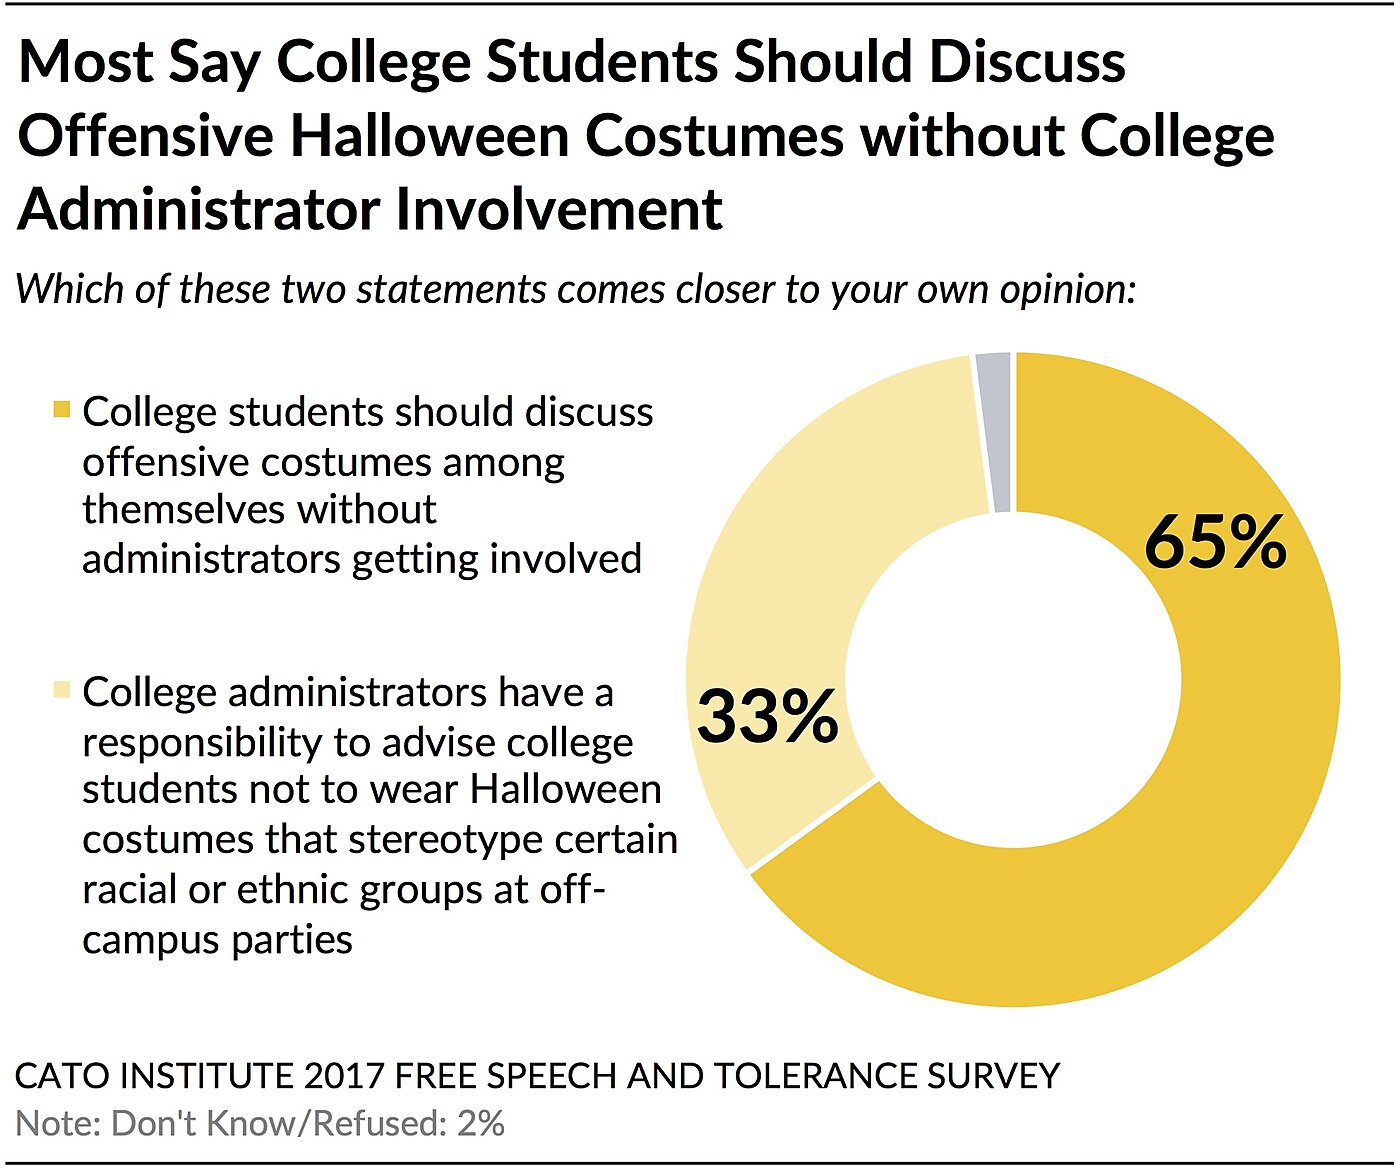
Nearly two-thirds (65%) say colleges shouldn’t advise students about offensive Halloween costumes and should instead let students work it out on their own. A third (33%) think it is the responsibility of the university to remind students not to wear costumes that stereotype racial or ethnic groups at off-campus parties.
20% of Current Students Say College Faculty Has Balanced Mix of Political Views
Only 20% of current college and graduate students believe their college or university faculty has a balanced mix of political views. A plurality (39%) say most college and university professors are liberal, 27% believe most are politically moderate, and 12% believe most are conservative.
Democratic and Republican students see their college campuses differently. A majority (59%) of Republican college students believe that most faculty members are liberal. In contrast, only 35% of Democratic college students agree most professors are liberal.

What Beliefs Should Get People Fired?
Americans tend to oppose firing people for their beliefs. Nevertheless, Democrats are more likely than Republicans to say a business executive should be fired if she or he believes transgender people have a mental disorder (44% vs 14%), that homosexuality is a sin (32% vs 10%), and that psychological differences help explain why there are more male than female engineers (34% vs. 14%). Conversely, Republicans are more likely than Democrats to say a business executive should be fired if they burned the American flag at a weekend political protest (54% vs. 38%).

Republicans Say Journalists Are an Enemy of the American People
A majority (63%) of Republicans agree with President Trump that journalists today are an “enemy of the American people.” Conversely, most Americans (64%), as well as 89% of Democrats and 61% of independents, do not view journalists as the enemy.

These results aren’t surprising given that most Americans believe many major news outlets have a liberal bias, including The New York Times (52%), CNN (50%), and MSNBC (59%). Fox is the one news station in which a majority (56%) believe it has a conservative bias.

Democrats, however, believe most major news organizations are balanced in their reporting including The New York Times (55%), CNN (55%), and CBS (72%). A plurality (44%) also believe the Wall Street Journal is balanced. The two exceptions are that a plurality (47%) believe MSNBC has a liberal tilt and a strong majority (71%) say Fox has a conservative bias.
Republicans, on the other hand, see things differently. Overwhelming majorities believe liberal bias colors reporting at The New York Times (80%), CNN (81%), CBS (73%), and MSNBC (80%). A plurality also feel the Wall Street Journal (48%) has a liberal bias. One exception is that a plurality (44%) believe Fox News has a conservative bias, while 41% believe it provides unbiased reporting.
Despite perceptions of bias, only 29% of the public want the government to prevent media outlets from publishing a story that government officials say is biased or inaccurate. Instead, a strong majority (70%) say government should not have the power to stop such news stories.
Americans Say Wedding Businesses Should Be Required to Serve LGBT People, Not Weddings
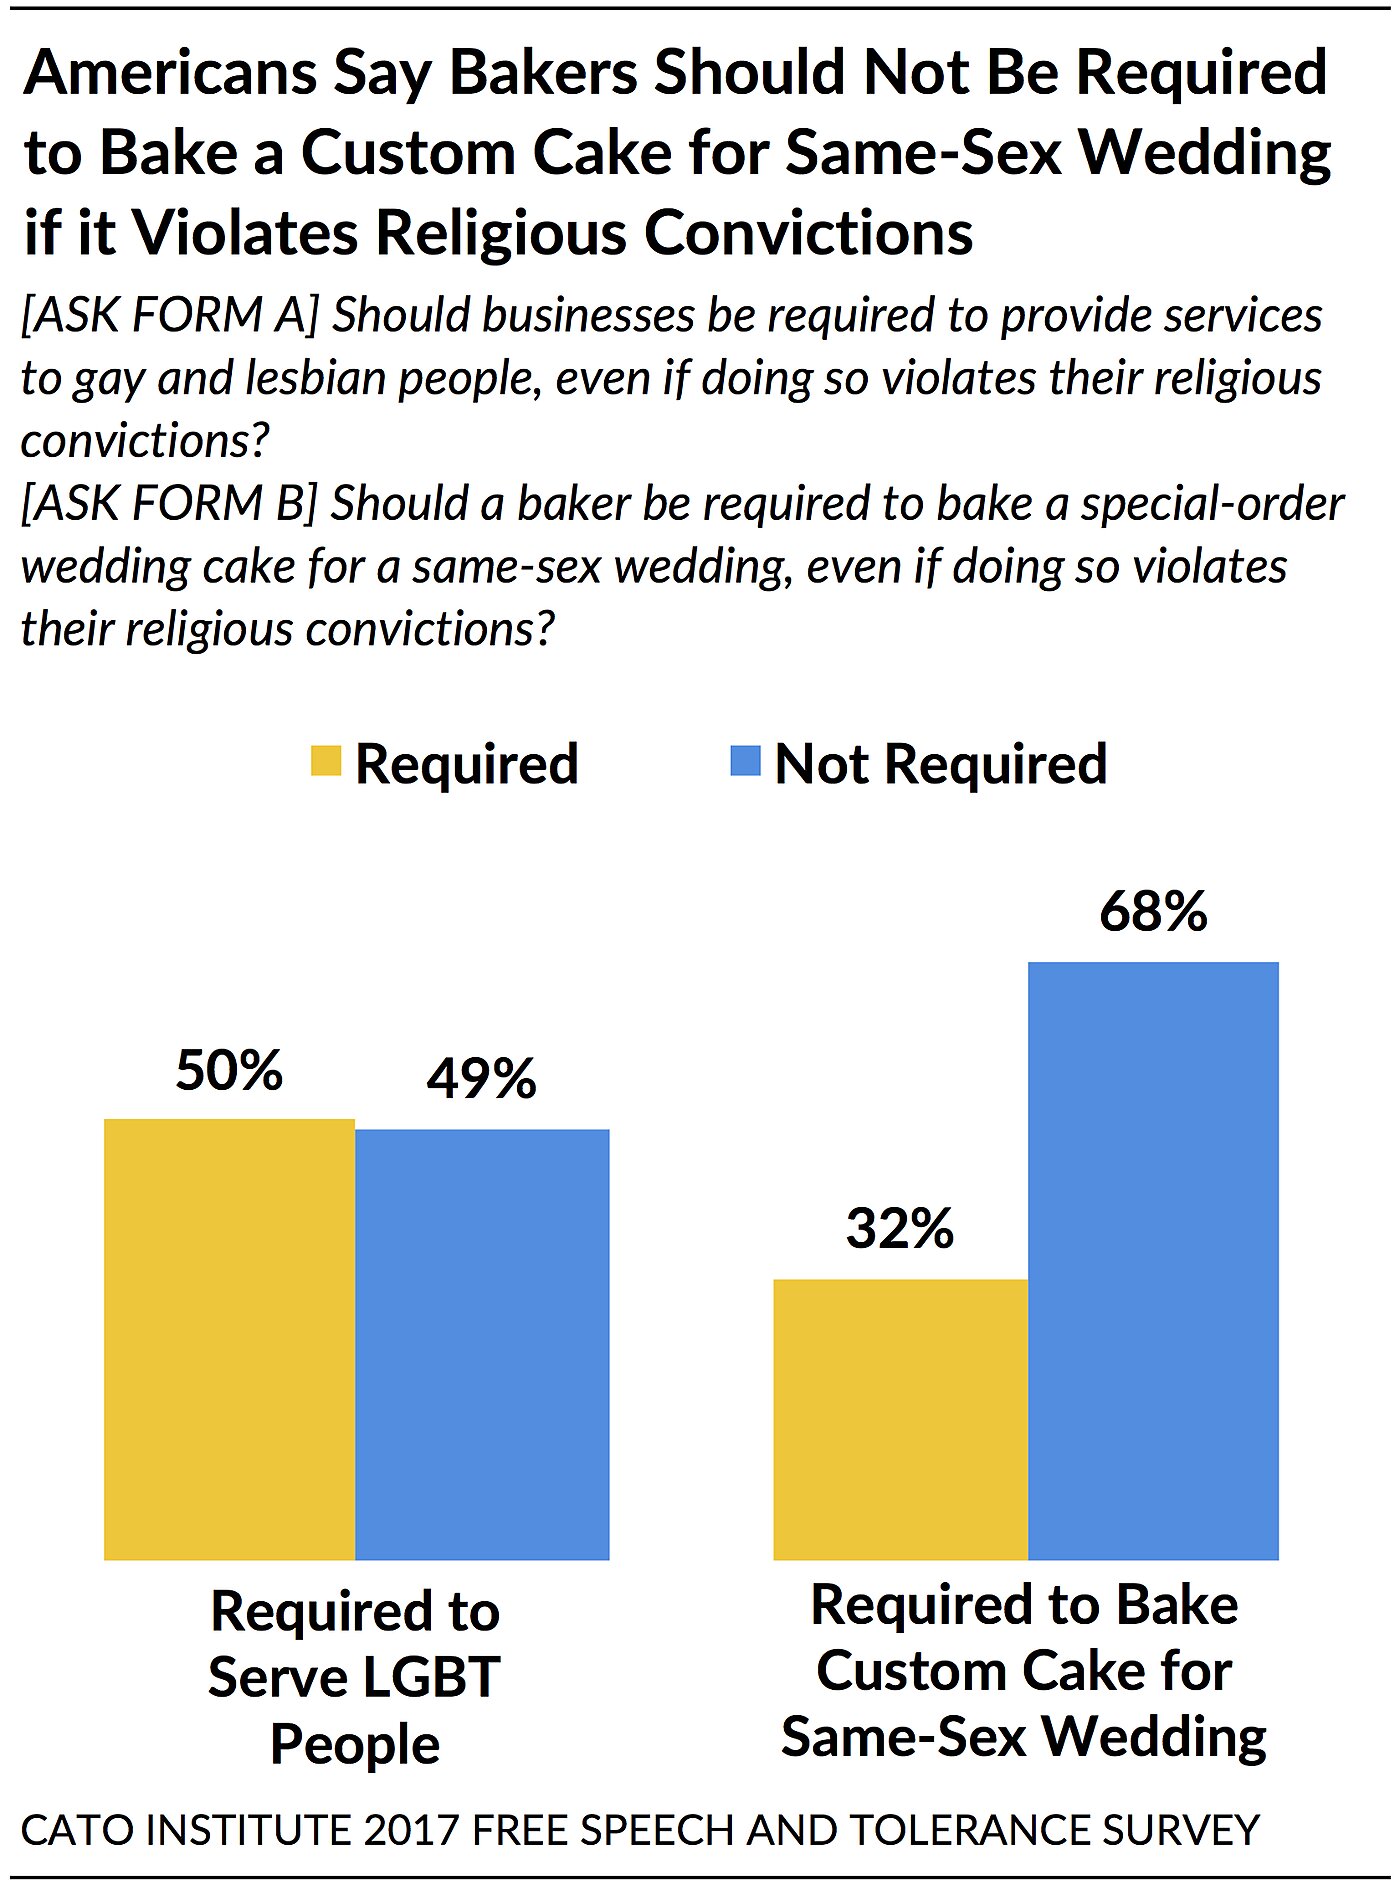
The public distinguishes between a business serving people and servicing weddings:
- A plurality (50%) of Americans say that businesses should be required to “provide services to gay and lesbian people,” even if doing so violates the business owners’ religious beliefs.
- But, 68% say a baker should not be required to provide a special-order wedding cake for a same-sex wedding if doing so violates their religious convictions.
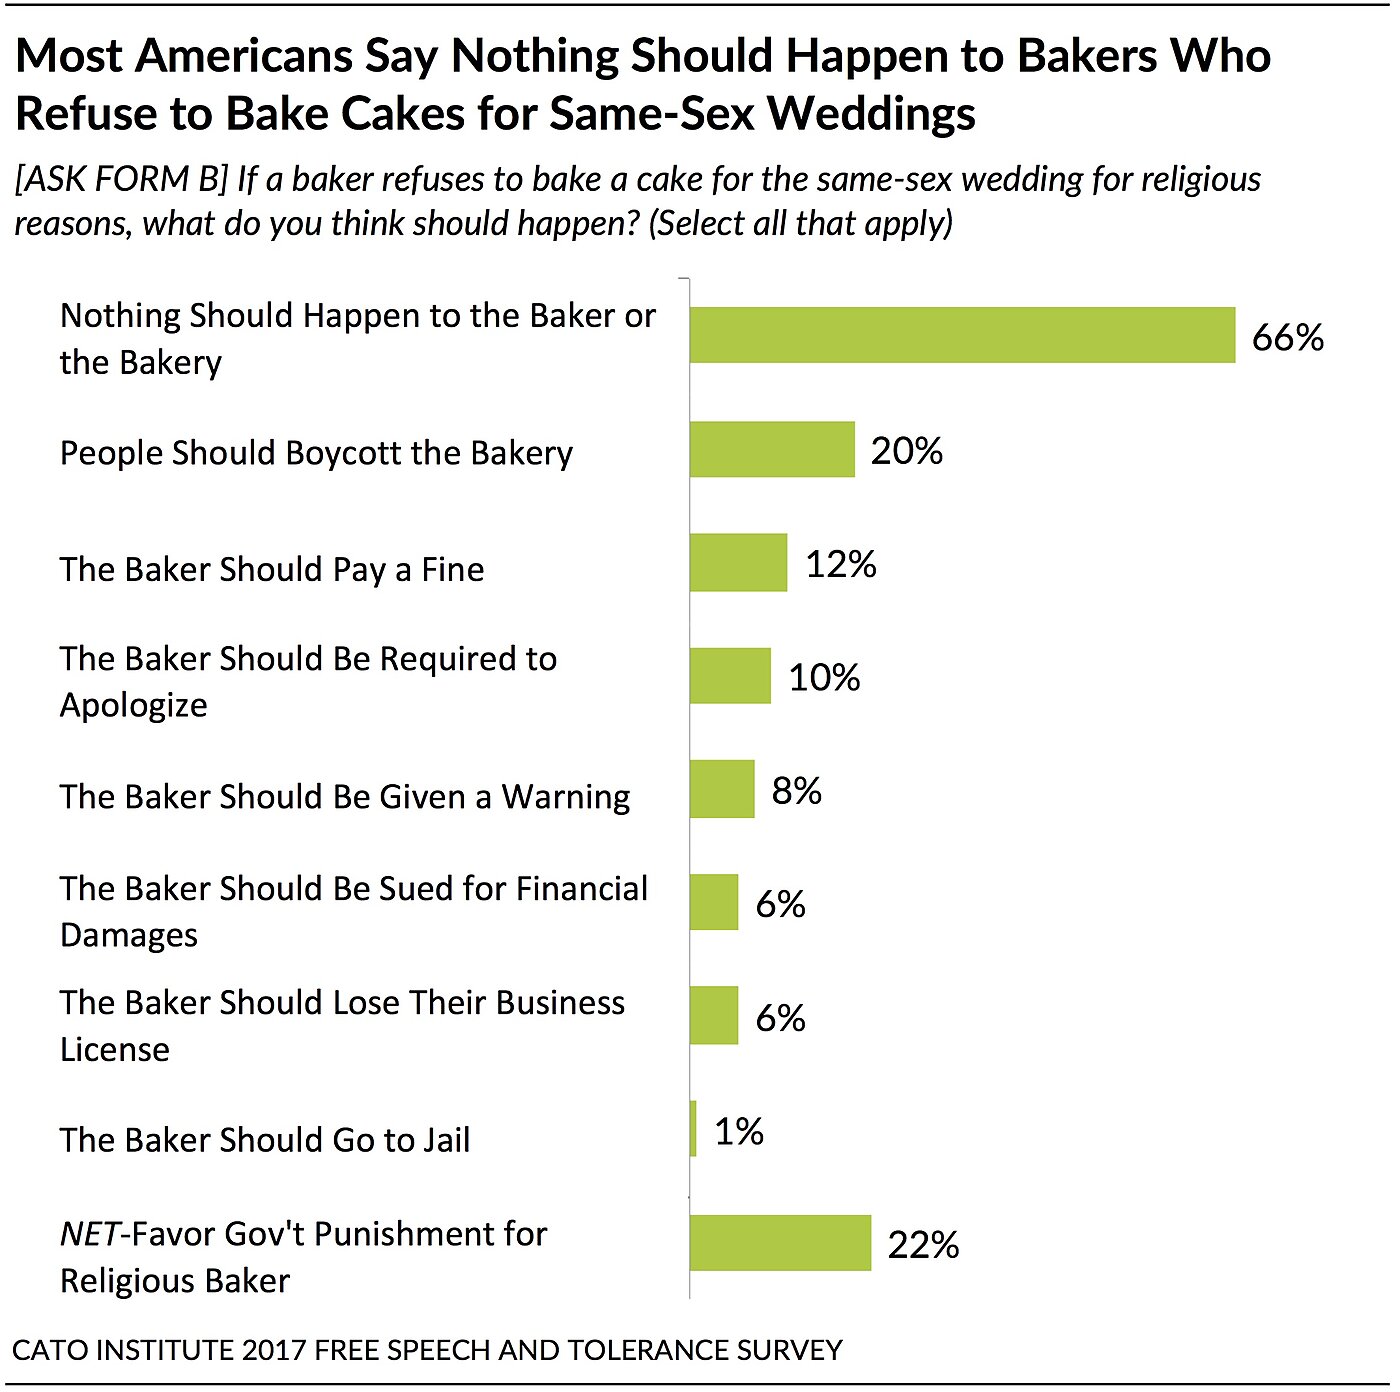
Few support punishing wedding businesses who refuse service to same-sex weddings. Two-thirds (66%) say nothing should happen to a bakery which refuses to bake a cake for a same-sex wedding. A fifth (20%) would boycott the bakery, another 22% think government should sanction the bakery in some way, such as fining the bakery (12%), requiring an apology (10%), issuing a warning (8%), taking away their business license (6%), or sending the baker to jail (1%).
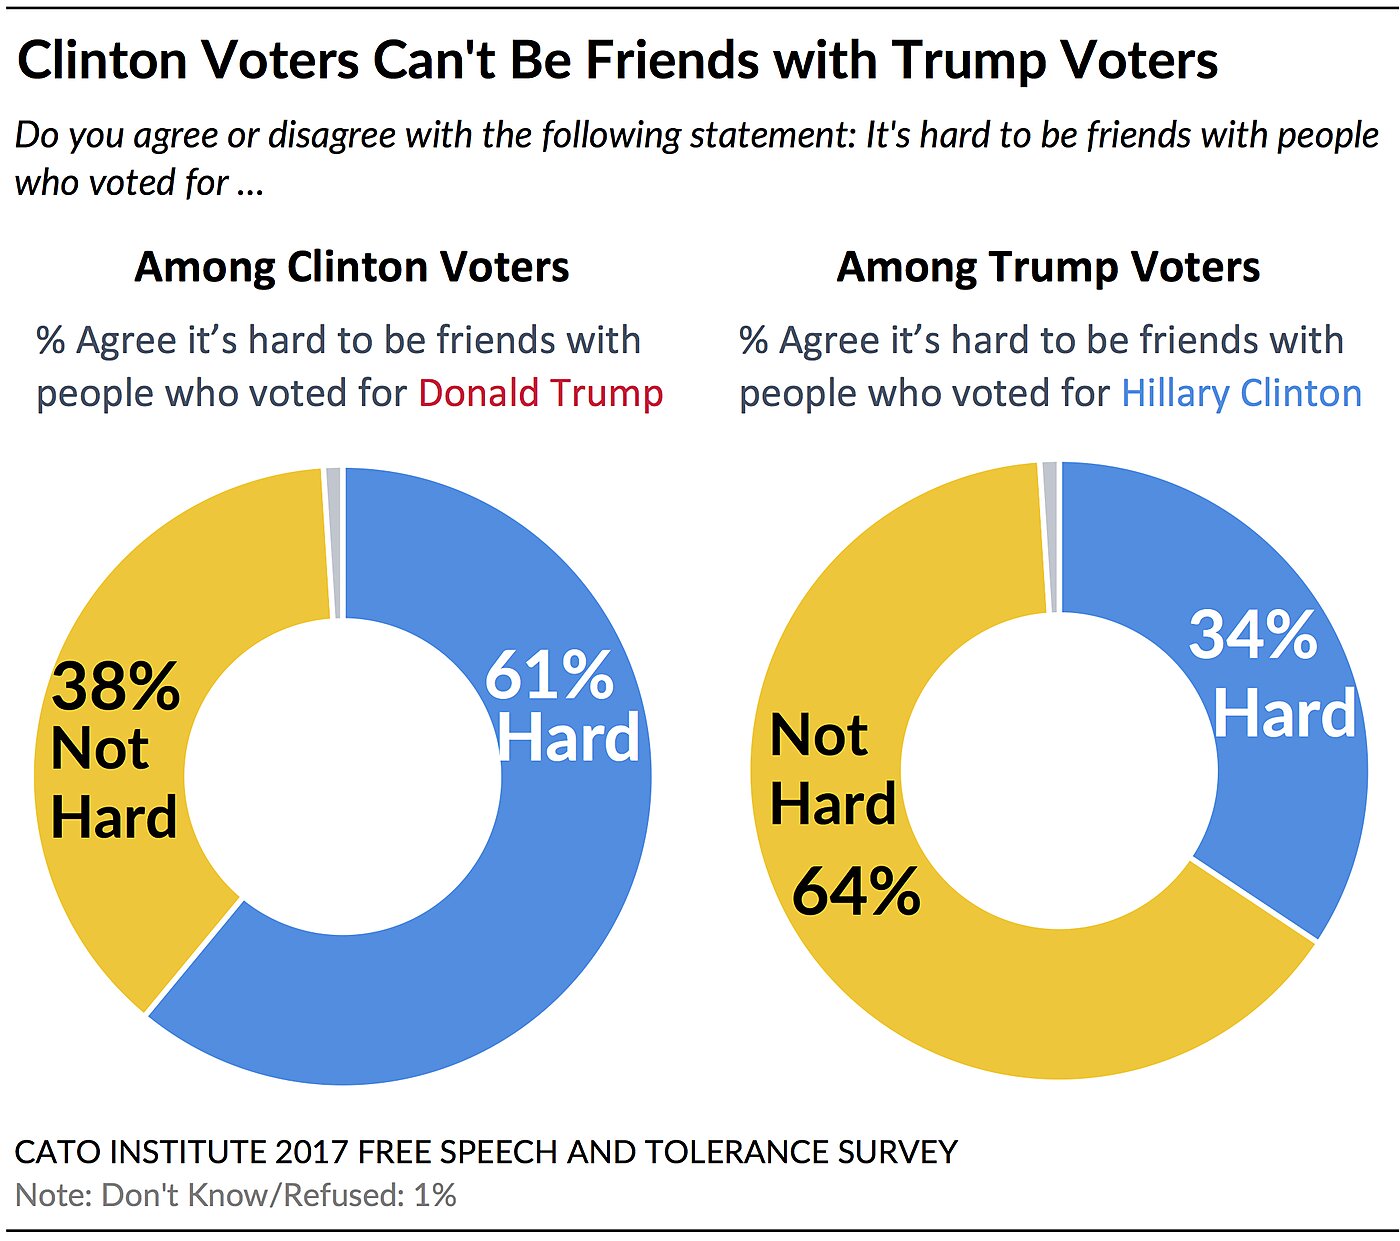
Clinton Voters Can’t Be Friends with Trump Voters
Nearly two-thirds (61%) of Hillary Clinton’s voters agree that it’s “hard” to be friends with Donald Trump’s voters. However, only 34% of Trump’s voters feel the same way about Clinton’s. Instead, nearly two-thirds (64%) of Trump voters don’t think it’s hard to be friends with Clinton voters.
Sign up here to receive forthcoming Cato Institute survey reports
The Cato Institute 2017 Free Speech and Tolerance Survey was designed and conducted by the Cato Institute in collaboration with YouGov. YouGov collected responses online August 15–23, 2017 from a national sample of 2,300 Americans 18 years of age and older. The margin of error for the survey is +/- 3.00 percentage points at the 95% level of confidence.
Labor’s Share of GDP: Wrong Answers to a Wrong Question
A recent paper by David Autor of MIT, Lawrence Katz of Harvard and others, “The Fall of the Labor Share and the Rise of Superstar Firms,” begins by posing a mystery: “The fall of labor’s share of GDP in the United States and many other countries in recent decades is well documented but its causes remain uncertain.” They construct a model to blame it on U.S. businesses that are too successful with consumers.
Five broad industries, they found, became more dominated by fewer firms between 1982 and 2012: retailing, finance, wholesaling, manufacturing and services. But those aren’t industries at all, much less relevant markets: they’re gigantic, diverse sectors. Is all manufacturing becoming monopolized? Really? Census data ignores imports, but why ruin this bad story with good facts.
Noah Smith at Bloomberg ran an audacious headline about this tenuous paper: “Monopolies drive down labor’s share of GDP.” Smith writes that, “The division of the economy into labor and capital is one place where Karl Marx has left an enduring legacy on the economics profession.” He goes on to claim that “at least since 2000 — and possibly since the 1970s — capital has been taking steadily more of the pie.” Yet, Jason Furman and Peter Orszag found “the decline in the labor share of income is not due to an increase in the share of income going to productive capital—which has largely been stable—but instead is due to the increased share of income going to housing capital.” Depreciation and government, they noted, also gained an increased share (i.e., grew faster than labor income.)
President Obama’s Council of Economic Advisers, under Jason Furman, nonetheless worried that the 50 [!] largest firms in just 10 “industries” (if you can imagine retailing and real estate to be industries) had a larger share of sales in 2012 than in 1997 (using Census data that excludes imports). They concluded that, “many industries may be becoming more concentrated.” Noah Smith, Paul Krugman and many others have suggested that this nebulous “concentration” allowed monopoly profits to rise at the expense of the working class, supposedly explaining labor’s falling share of GDP during the high-tech boom. A quixotic search for even one actual example of monopoly soon morphed into advice about using unconstrained antitrust to constrain Amazon, which is apparently feared to have monopoly profits invisible to the rest of us.
Research that starts with such a meaningless question as “labor’s share of GDP” was never likely to lead us to any profound answers. Workers do not receive shares of GDP – they receive shares of personal or household income.
Contrary to popular confusion, dividing employee compensation (wages and benefits) by GDP does not measure how a capitalist private economy (e.g., “superstar firms”) divides income between labor and capital. Most obviously, the government makes up a huge share of GDP, including nonmarket goods like defense and public schools. Nonprofits also account for a lot of GDP, with no obvious payout to labor or capital. Less obviously, depreciation makes up another huge share of GDP, including wear and tear on public highways and bridges as well as private equipment, homes, and buildings. The “imputed rent on owner-occupied homes” is another large piece of GDP. Asking if labor is getting a fair share of defense, depreciation and imputed rent is a truly foolish question. Net private factor income would be a better gauge than GDP, for the purpose at hand, but still flawed.
The ratio of compensation to GDP uses the wrong numerator as well as an untenable denominator. Labor income must add the labor of self-employed proprietors.
When people say “labor’s share is falling,” they surely mean income people receive from work has not kept up with income people (often the same people) receive from property: dividends, interest, and rent. But, that crude Piketty-Marx labor/capital dichotomy ignores another increasingly important source of personal income: namely, government transfer payments from taxpayers to those entitled to cash and in-kind benefits.
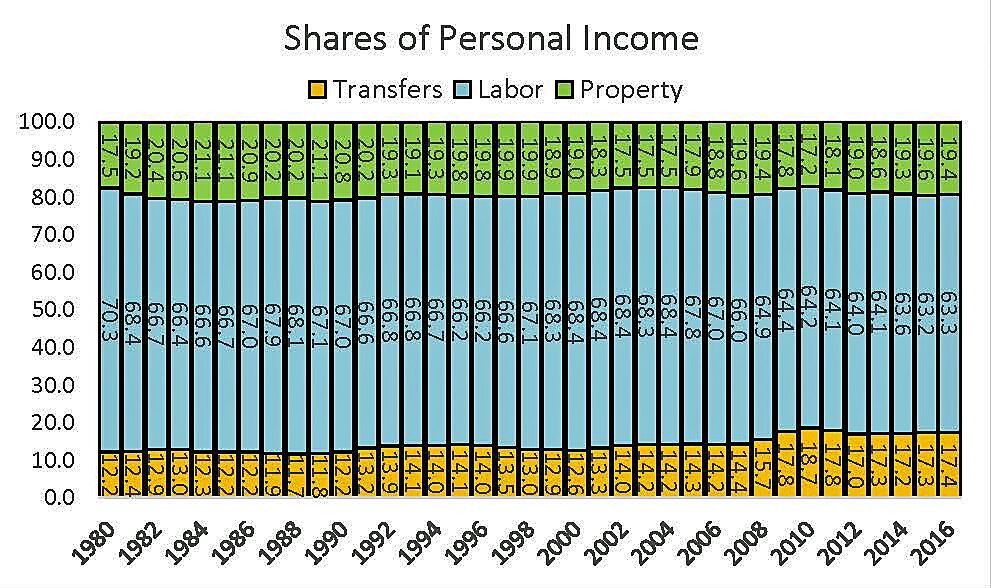
The first graph shows shares of income from labor, property, and transfers. The property share peaked at 21.1% in 1984–85, as the Fed kept interest rates very high, but averaged 19.3% and was 19.4% in 2016 (after dropping to 17.8% in 2009). The labor share averaged 66.5% but was 63.3% in 2016 even though property owners’ share was virtually flat. What went up? Transfer payments. Transfers rose from 11.7% of personal income in 1988 to 17.4% in 2016. Personal income that has been growing persistently faster than income from work has not been income from property (since the 1980s), but income from Social Security, Disability, Medicare, Medicaid, EITC, TANF, SNAP, SSI, UI, and so on.
Some might object that personal income leaves out retained corporate profits. But profits not paid out as dividends add to people’s income only if they are reinvested wisely enough to lift the value of the firm and thus generate capital gains. Personal income excludes capital gains because national income statistics measure flows of income from current production, not asset sales. That is also true of GDP, adding another reason to discard GDP as the basis of comparison.
However, Congressional Budget Office reports on the distribution of income do include realized capital gains when assets are sold (turning wealth into income).

The second graph shows that labor’s share of household income is highest in deep recessions (77.5% in 1982, 76.2% in 2009) and lowest at cyclical peaks (70.6% in 2000, 68.3% in 2007). The higher labor share in recessions does not mean recessions are good for workers, of course, but that they are even worse for business and investors. Those who equate a higher labor share of income (e.g., during recessions) with higher real income for workers are making a basic and very large mistake.
Capital income was highest in the early 1980s because the Federal Reserve kept interest rates very high, and capital income (dividends, interest, and rent) has shown no upward trend since then. Dividends and rent are up, but interest income is down.
Capital gains rose at specific times, but there has been no upward trend. There was a spike in capital gains in 1986 because the tax on gains jumped to 28% the following year. Realized gains also rose for four years after the capital gains tax was brought back down to 20% in 1997, and again after the capital gains tax was cut to 15% in mid-2003.
The white space at the top is important because it increases by four percentage points from 1990 (15.3%) to 2016 (20.3%) while labor’s share fell by 2.5 percentage points (from 75% to 72.5%). That white space is transfer payments: income from neither labor or capital. As the first graph showed, labor’s somewhat smaller share of income is not because of any sustained rise of capital income or capital gains. It is because of a sustained rise in the share of income from transfer payments and a sustained fall in the labor force participation rate.
Meanwhile, household income from owning a closely-held private business doubled since 1986: from 4% of household income in 1986 to 8% in 2013. That reflects the well-known shift of income from corporate to “pass-through” entities after 1986 as the top individual tax rate became even lower than the corporate tax rate (1988–92) or about the same dropped to the same as the corporate rate (35% 2003–2012)) or lower. That did not mean that “business” grabbed a bigger share at the expense of “labor,” but that a larger share of business income shifted from corporate to personal data.
The frequently repeated angst about “the fall of labor’s share of GDP in the United States” is based on a serious yet elementary misunderstanding of both labor income and GDP. “Labor’s share of GDP” is fundamentally nonsensical, because so much of GDP (depreciation, defense, etc.) could not possibly be paid to workers, and because the measure of labor income is too narrow (excluding the self-employed).
Labor’s share of the CBO’s broadly-defined household income also fell (unevenly) because the share devoted to transfers rose, but also because the share moved from corporate to household accounts (and individual tax returns) also rose. Business income counted within CBO’s household income has increased its share of such income since the Tax Reform Act of 1986, but that just reflects a change in organizational form from C‑Corporation to pass-through status.
Labor’s share of personal income fell mainly because the share devoted to government transfer payments rose. Labor’s share of GDP fell for other reasons (rising shares going to housing, government, and depreciation), but it is a fundamentally misconstrued statistic used to rationalize irresponsible remedies to an illusory problem of “monopolies.”
Follow the Leader
The Washington Post sums up the situation:
It was a party scarred by the madness, cruelty and famine that one man had prompted through disastrous policies.…
Senior officials lined up, one after the other, to laud what they described as [the leader’s] profound, courageous, thrilling, insightful masterpiece of a speech.…
And the drumbeat of propaganda about loyalty to his leadership — combined with the constant threat of an unforgiving … campaign that has taken down several powerful rivals — makes it more difficult for anyone who dares challenge him.…
[His] message promotes a nationalist, assertive [country] with a much stronger military — a country that he says will not threaten the world but will resolutely defend its interests.
If you are uncertain about which country and which leader, click here.