When it comes to individual taxes, key Republican legislators seem to think “reform” is mainly about limiting or eliminating certain itemized deductions, rather than about raising revenue in ways that do the least damage to the economy (by minimizing tax distortions and disincentives).
This emphasis on curbing itemized deductions is often compared with the Tax Reform Act of 1986 (TRA86), which supposedly “paid for” cutting the top tax rate from 50% to 28% by slashing several itemized deductions. In reality, however, most extra revenue from repealing itemized deductions after 1986 was devoted to raising the standard deduction, leaving total deductions unchanged. This is apparent in the graph below, which shows total deductions – both itemized and standard – as a percentage of Adjusted Gross Income.
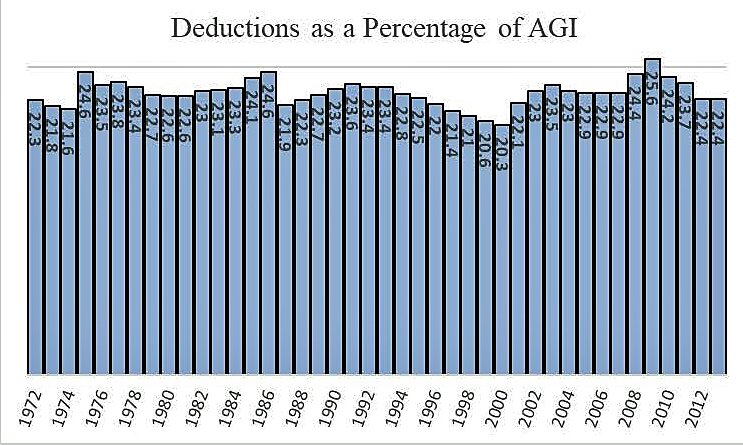
Deductions averaged 23.1% of AGI from 1976 to 1984, and deductions also averaged 23.1% of AGI from 1989 to 1995. In between, the reform merely shifted the timing of deductions. Deductions were pushed forward into 1985–86 to take advantage of those that were about to expire (e.g., the tax-deduction for credit card interest). Moving deductions forward held down deductions briefly in 1987–88 before they climbed back up again.
Note that total deductions were also unaffected by the fact that the maximum marginal benefit of itemized deductions (the amount saved per dollar) had fallen to 28–31% from 1988 to 1992. President Obama proposed to limit itemized deductions to 28% of the amount spent, but we already tried that in 1988–90, without success. Whatever the effect of the 1986 law eliminating several itemized deductions, plus the deep reduction in the marginal tax benefit, both were overwhelmed by the larger standard deduction.
Standard deductions doubled – from $151 billion in 1986 to over $309 billion in 1989. The only reason that is called “reform” is that politicians only define itemized deductions as “loopholes,” although the standard deduction obviously has the same effect on taxable income. Tax exemption and tax credits are far more valuable than deductions, yet (like the standard deduction) are commonly not described as “loopholes” as a matter of semantic convention (or confusion).
If the standard deduction soon rises to $24,000 per couple, as the GOP proposes, even couples with a $100,000 income would automatically have higher than average deductions.
The graph also shows that the ratio of deductions to income is clearly cyclical – rising in recessions like 1975 and 2009 because income fell more than deductions, then falling during the 1997–2000 stock boom as incomes (including capital gains and stock options) grew faster than deductions.
Reynolds’ Law of Taxes says the individual income tax will always hover around 8% of GDP, give or take one percentage point, regardless whether the top tax rate is 28%, 39.6%, 70% or 92%. Now, let’s add Reynolds’ Law of Deductions: Deductions will always hover around 23% of AGI, give or take one percentage point, regardless of whether itemized deductions are expanded, limited, or repealed.
Laws to limit itemized deductions, unlike booms and busts, have never had a noticeable lasting impact, largely because of Congressional fondness for raising standard deductions (and refundable tax credits, a super-loophole not counted here).
The Bush 41 Pease limitation on deductions was an anti-affluence political stunt making little noticeable difference. Revived in 2013, the Pease limits reduce the value of a taxpayer’s itemized deductions by 3% for every dollar of taxable income above $313,800 on a joint return. This adds about a percentage point to the top two marginal rates (and so does the PEP phase-out of personal exemptions). The Pease limits first began to phase-out itemized deductions of “the rich” in 1991, yet total deductions rose to 23.4–23.6% of AGI in 1991–93. The Pease phase-out was reinstated in 2013, yet total deductions remained the same as in 2012. Itemized deductions went down by $50.1 billion in 2013 and standard deductions went up $51.2 billion.
Doubling the standard deduction to $24,000 per couple appeared to be the primary revenue-losing objective of the GOP Big Six plan (losing $890 billion over 10 years by one estimate). Meanwhile, there have been reports of backpaddling on trial-balloons about ending property tax deductions and curbing contributions to 401(k) plans. It is not difficult to imagine the end result being that any revenue gained from limiting deductions barely offsets revenue lost by expanding the standard deduction, leaving deductions still stuck around 22–23% of AGI.
That would be like 1986 but with one big difference. In 1986, the top tax rate was cut by 22 percentage points, leaving a nearly-flat 15–28% rate structure. This year, by contrast, high-income taxpayers are not giving up big deductions and personal exemptions for a lower-rate, since the top rate is apparently to stay at 39.6%. Itemized deductions go down, personal exemptions completely vanish, yet targeted tax credits get larger (e.g., for children under age 17) and the standard deduction goes up. Tax-deferred contributions to retirement savings plans may be deeply slashed.
By rejiggering exemptions, deductions, and credits with essentially no change in the highest, most damaging tax rates, the individual side of the Republican “tax cut” is shaping up as a sizable tax increase for well-educated two-earner couples with college-age kids living in high-cost metropolitan areas, among others.
