Speaker of the House Nancy Pelosi, together with Rep. Jamie Raskin (D‑MD), held a press conference on Friday to introduce a bill to create a new body with an unwieldy name: the Commission on Presidential Capacity to Discharge the Powers and Duties of Office. Widely perceived as a largely symbolic action to highlight President Trump’s muddled handling of his recent COVID-19 diagnosis, this bill would invoke Congress’s power under the Twenty-fifth Amendment. In spite of the obvious timing, Pelosi insisted this bill is not about the current president. Raskin has proposed similar legislation earlier in Trump’s term, and the idea has come up sporadically over the decades.
President Trump’s fitness and immediate politics aside, is this bill a good idea? First, it’s important to understand the mechanics of the Twenty-fifth Amendment. Among other provisions, this amendment—passed in the wake of the Kennedy assassination and previous presidential health crises—allows the president to temporarily transfer power to the vice president, correcting a dangerous oversight in the original Constitution. This provision, in Section 3 of the amendment, has been invoked on occasion when presidents underwent medical procedures requiring sedation.
Section 4 is designed to handle the possibility of a president who is incapacitated before he or she is able to voluntarily transfer power. This requires invocation by the vice president, who together with “a majority of either the principal officers of the executive departments [i.e. the Cabinet] or of such other body as Congress may by law provide” may transfer power. The amendment then sets up a procedure for Congress to decide the matter if the president disputes his claimed inability.
Since the Twenty-fifth Amendment was ratified, Congress has never provided for “such other body,” leaving the decision with the fifteen members of the Cabinet. Raskin’s bill would change that by creating a bipartisan commission consisting of a mix of medical professionals and former senior executive branch officials.
Contrary to some pundits and media coverage, this bill would not amount to Pelosi herself invoking the Twenty-fifth Amendment or removing Trump from office, nor is the possible use of the Twenty-fifth Amendment an unconstitutional “coup.” Any such move to invoke Section 4 would still require the assent of the vice president, the president’s hand-picked running mate and designated successor. Even if Section 4 were invoked, sustaining it over a president’s objection requires two-thirds majorities in both the House and Senate, a higher hurdle than impeachment and conviction. Pelosi’s concern might be political messaging, but for the immediate circumstances it’s not much more than that.
Raskin has long championed the idea out of apparently genuine concerns about continuity of government. But that doesn’t make it a good idea. The inclusion of medical professionals might sound reasonable, but invocation of the Twenty-fifth Amendment is not really a medical decision. It is a legal decision based on constitutional and policy concerns, and a variety of practical reasons weigh in favor of leaving the power where it is, with currently serving senior executive branch officials.
Consultation with the president’s doctors would certainly be part of the decision. In most cases, it wouldn’t be a close call. If the president is comatose or the equivalent, the need to transfer power is obvious enough. Borderline cases might involve severe senility or a mental health crisis. But the medical ethics involved here are tricky at best, particularly for doctors who might not have directly examined the president. It’s even more dubious given that four of the eight medical professionals to be chosen would be psychiatrists. Removing an elected officeholder from power is not properly the role of physicians or psychiatrists. Even more troublesome is Raskin’s provision for Congress to request a medical examination of the president, a procedure not contemplated by the Constitution.
The inclusion of retired officials is also problematic. Raskin’s bill would provide for congressional leaders of both parties to name an equal number from among former presidents and vice presidents, former heads of the departments of State, Defense, Justice, or Treasury, or former surgeons general. These, together with the doctors also chosen on an equal bipartisan basis, would number sixteen and then vote among themselves to select a seventeenth member as chairman.
Part of the point of Section 4 is to provide swift action in an immediate crisis, including at the most extreme a possible attack on the United States requiring a military response from the commander-in-chief. When the amendment was ratified at the height of the Cold War, nuclear command and control was a real concern, and it still is. There should be no ambiguity or delay in deciding who has their finger on the button.
Members of the Cabinet are well positioned to serve in this role. Since they are already serving as senior government officials, and in particular are in the presidential order of succession, they are in constant communication and most have protective security details. Their location is never unknown, they can be quickly reached, and they are already in the loop on major policy decisions. They are also appointed by the president, providing a greater degree of legitimacy and fewer chances for politically motivated action to remove a duly elected chief executive.
Former officials, on the other hand, are not in such constant contact. They will be scattered around the country, may be difficult to reach quickly if needed, may be of advanced age themselves, and do not regularly meet with the president to judge any changes in his condition. In the event of a sudden emergency, summoning Raskin’s proposed Commission to act could take crucial hours, defeating a major purpose of Section 4. The large number of Commission members involved—seventeen, up from the Cabinet’s current fifteen—adds to the procedural complexity when time might be of the essence.
Though the vice president would still provide an important check, the political optics of a president being removed by members of the opposition party would also be worth avoiding, particularly members of a previous administration of the opposite party. It doesn’t take much imagination to see how partisans would react to Eric Holder or Loretta Lynch voting to depose Donald Trump.
Raskin aims to take the decision out of the hands of officials he sees as too dependent on the president, including that they are potentially fireable by him. But requiring a Section 4 invocation to come from those close to and politically aligned with the president is a feature, not a bug. It adds needed legitimacy and reduces the possibility of partisan abuse.
Trump’s behavior and personality, especially in his current medical condition, have prompted real concerns about his fitness for office. A responsible and prudent president might have voluntarily invoked Section 3 upon being hospitalized and quarantined. But Trump has not reached the point that would justify involuntary transfer of power over his objection under Section 4, especially given the bipartisan supermajorities that would be required to sustain that decision. He may be erratic, and maybe even incompetent, but he is not literally unable to sign bills or issue orders. That Section 4 hasn’t been invoked to date is not a failure in need of remedying, as Cato’s Gene Healy explained in response to Twenty-fifth Amendment talk earlier in Trump’s presidency.
Well-intentioned though it may be, this plan is not the improvement Section 4 needs. It would undermine the continuity of government that Section 4 aims to preserve. That doesn’t mean changes aren’t worth considering, though. One possibility would be to remove lower-ranked Cabinet officials such as the secretaries of education and agriculture. The “big four” positions of State, Defense, Treasury, and Justice might be more nimble and are more likely to be involved in national security crises, since they already serve as members of the National Security Council. Those four together, possibly with others who work closely with the president such as the national security advisor or chief of staff, might be an improvement over the full fifteen-member Cabinet, ensuring the ability for prompt action in an emergency.
For further discussion of the Twenty-fifth Amendment, I highly recommend the definitive book on the subject, Unable: The Law, Politics, and Limits of Section 4 of the Twenty-Fifth Amendment by Brian C. Kalt of Michigan State University.
Cato at Liberty
Cato at Liberty
The Department of Labor’s (DOL) new rule changes how it calculates the mandatory minimum wage—called the prevailing wage—for employers of H‑1B and permanent foreign workers. DOL adopts a fundamentally flawed methodology as its basis to inflate the prevailing wage. But a bigger issue is that DOL itself failed to understand how much its methodological changes would artificially raise the required wages. DOL estimated the wage effects of its rule using completely erroneous assumptions, and so it understates to the public the wage increases by, in many cases, as much as 26 percent.
The prevailing wage is supposed to approximate the wages of similarly skilled U.S. workers. DOL currently uses the Bureau of Labor Statistics’ (BLS) Occupational Employment Statistics (OES) survey to create a prevailing wage for four skill levels within each occupation in every area of the country. The creation of the skill levels—which is the focus of this rule—is contentious because the OES doesn’t directly record skills. Instead, BLS creates these skill levels mathematically based on the reasonable assumption that higher wages within an occupational category within a specific area generally reflect higher skills.
Table 1 compares the new and old prevailing wage methodologies. Previously, DOL had assumed that the bottom third of the wage distribution represented entry level wages, while the rest (the top two thirds) were not entry level. After averaging the wages in the bottom third and top two thirds to create the Level 1 and Level 4 wages, it placed the two other wage levels equally distant between them. The new rule, however, ignores all wages below the 40th percentile—averaging the 40th to 50th percentiles to determine the starting wage—and rather than averaging all other wages to produce Level 4 as before, it only averages the top decile of wages (the 90th to 100th percentile).
The big error that DOL makes is that it assumes that averaging the top decile will equal the 95th percentile. Since the top decile (the top 10 percent of wage earners) includes some extreme outliers and a very small sample size, those outliers skew the level 4 wage far higher than the 95th percentile. Because the Level 2 and Level 3 wages are dependent on the Level 4 wage calculation, it also mistakes where these wage levels will fall on the wage distribution. This becomes incredibly important when DOL then tries to estimate the wage impact of the new rules:
To estimate the wage impacts of new percentiles contained in this [rule], the Department used publicly available BLS OES data that reports the 10th, 25th, 50th, 75th, and 90th percentile wages by SOC code and metropolitan or non‐metropolitan area. In order to estimate wages for the new IFR levels of 45th, 62nd, 78th, and 95th percentiles, the Department linearly interpolated between relevant percentiles for reported wages at each SOC [job] code and geographic area combination. [Endnote: For example, if OES reports a wage of $30 per hour at the 25th percentile and $40 per hour at the 50th percentile then the 45th percentile is interpolated as $30+($40-$30)*((45–25)/(50–25)) = $38 per hour.] For the 95th percentile, the Department used OES wages reported for the 90th percentile at each SOC code and geographic area combination. (p. 126)
In other words, DOL did not even try to estimate what the actual 95th percentile would be. For reasons that are only explicable as laziness or hastiness, it did not ask BLS to calculate the new prevailing wages until after it issued the rule. Instead, it just settled on using the 90th percentile as a stand‐in for the level 4 wage to estimate the rule’s effects because it thought that it would be similar. It then tried to calculate the level 3 and level 2 wages assuming that they would be around the 78th and 62nd percentiles, respectively. But this was wrong.
Table 2 is an example of DOL’s assumed wage levels for San Francisco architects and New York City management analysts under the new rule and what the actual wage levels now are. For wage levels 2–4, DOL’s estimate is wildly inaccurate—underestimating the actual amount by 15–18 percent for level 2, 23–25 percent for Level 3, or 24–26 percent for level 4. These huge differences appear in every single occupational category. Notice that in the examples below, the actual level 2 wage is higher than what DOL assumed would approximate the level 3 wage, and the actual level 3 wage is higher than what DOL assumed would approximate the level 4 wage.
DOL repeatedly refers to the wage levels as “percentiles,” misstating its own methodology which is based on averaging the 5th decile and the top decile and then imputing the middle two wage levels equally distant from the other levels. Because the level 4 wage is so inflated, the other two middle wage levels are also widely off to the point that what DOL refers to as the “78th percentile” (level 3) is actually above the 90th percentile in the two examples above.
Because DOL decided not to ask BLS for the actual OES data that it would use to create the new wage levels, it missed how egregious this mistake was. Moreover, because DOL refused to let the Office of Management and Budget review the rule, this massive error slipped through unnoticed. Finally, because DOL made the rule take effect almost immediately and refused to accept public comments on the rule, it has no time to correct it before the rule begins to effect tens of thousands of American businesses. DOL should immediately rescind the rule and start the process over.
Post was updated to clarify that the methodology of the entry level wage is the average of the 5th decile, not the 45th percentile exactly.
Related Tags
This election, Americans will not only be choosing politicians for office but also whether to increase or decrease taxes in many places.
In Arizona, voters will decide on Proposition 208, which would raise income taxes by 3.5 percentage points on high earners. Polls are showing the proposition may pass.
In Illinois, voters will decide whether to amend the state constitution to convert the state’s flat individual income tax into a multi-rate system. The current income tax rate of 4.95% would be replaced by a six-rate system with a top rate of 7.99%.
The Illinois ballot measure was spearheaded by Governor J.B. Pritzker, who received an “F” on the new Cato Institute fiscal report card. According to Ballotpedia, billionaire Pritzker has personally contributed $56 million to the 2020 ballot campaign for passage.
Which side do voters usually take on income tax ballot questions? My intern, Hunter Brazal, looked through Ballotpedia over the 2010 to 2019 period to find statewide individual income tax measures. He found 20 including 13 aimed at increasing taxes and 7 aimed at cutting or limiting taxes.
To increase the appeal of tax-increase proposals, supporters often pair them with promised increases in specific spending. Arizona’s Proposition 208, for example, promises to increase education spending.
There is modestly good news: voters favored the small-government side on 12 of the 20 tax measures. Here are the results with vote percentages from Ballotpedia:
Wins for Bigger Government
- In 2016, California Proposition 55 would extend the Proposition 30 (2012) tax rate increases on high earners to fund education and healthcare. Passed 63.3 to 36.7.
- In 2016, Maine Question 2 would raise the income tax rate three percentage points on high earners to fund education. Passed 50.6 to 49.4. The governor and legislature subsequently repealed the increase.
- In 2014, an Illinois question would amend the constitution to increase the income tax rate by 3 percentage points on high earners to fund education. Passed 60.0 to 34.2 (with 5.8 not voting on this question). The question was advisory only and not implemented.
- In 2012, New Hampshire CACR 13 would amend the constitution to ban new taxes on personal income. Passed 57.1 to 42.9 but came short of the needed two-thirds vote.
- In 2012, California Proposition 30 would increase income tax rates on high earners including a new top rate of 13.3 percent. It would also raise the sales tax rate. Passed 55.4 to 44.6.
- In 2012, Michigan Proposal 5 would amend the constitution to require supermajorities in the legislature or statewide voter majorities to raise taxes. Failed 31 to 69.
- In 2010, Oregon Measure 66 would raise the top income tax rate. Passed 54.3 to 45.7.
- In 2010, Colorado Proposition 101 would cut the income tax rate, limit vehicle fees, and reduce other taxes and fees. Failed 32.3 to 67.7.
Wins for Smaller Government
- In 2019, Texas Proposition 4 would amend the state constitution to prohibit individual income taxes. Passed 74.4 to 25.7.
- In 2019, Washington Advisory Vote 20 would approve an 0.58 percent wage tax to fund healthcare services. Failed 37.1 to 62.9.
- In 2019, Colorado Proposition CC would retain tax revenue for spending rather than refund it to taxpayers under TABOR. Failed 46.3 to 53.7.
- In 2018, Maine Question 1 would raise wage and nonwage taxes on high earners to fund a home care program. Failed 37.1 to 62.9.
- In 2018, a North Carolina ballot question would amend the constitution to reduce the maximum allowable income tax rate from 10 percent to 7 percent. Passed 57.4 to 42.7.
- In 2018, Colorado Amendment 73 would raise income tax rates for high earners to fund education. The state’s flat-rate tax of 4.63 percent would be replaced by a multi-rate system with rates up to 8.25 percent. Failed 46.4 to 53.6.
- In 2014, Georgia Amendment A would amend the constitution to prohibit increases in the maximum income tax rate above 6 percent. Passed 73.9 to 26.1.
- In 2014, Tennessee Amendment 3 would prohibit the legislature from imposing any state or local tax on wages or earned income. Passed 66.2 to 33.8.
- In 2013, Colorado Amendment 66 would amend the constitution to replace the 4.63 percent income tax with a multi-rate system having rates of 5.0 percent and 5.9 percent. The higher revenues would fund education. Failed 35.5 to 64.5.
- In 2012, California Proposition 38 would increase income tax rates for nearly all households to fund education. Failed 28.7 to 71.3.
- In 2011, Colorado Proposition 103 would increase the income tax rate from 4.63 percent to 5.0 percent, as well as increase the sales tax rate to fund education. Failed 36.3 to 63.6.
- In 2010, Washington Initiative 1098 would impose an income tax on high earners. Failed 35.9 to 64.2.
I have discussed many of these ballot questions in current and past issues of Cato’s Fiscal Report Card on the Governors.
Related Tags
Let’s hope President Trump’s health is as sound as he says it is and he’s well on the road to recovery. He certainly seems… chipper, at any rate. Still, you’d be a fool to take such professions on faith—not just because of the non-stop frenzy of dissembling and double talk we’ve seen since Friday, when the president revealed he was COVID-positive—but because of the long history of official lies about presidents’ health.
When I saw the headline “Medical Spin in Past Undermines Trust” in Sunday’s New York Times, I thought they’d go into some of that history. But the article’s mostly about past dissembling by this president’s doctors about this president’s health. Fair enough, but a longer view gives us still more reason to verify, instead of trust, official pronouncements about the state of any president’s health.
The best-known story is probably Woodrow Wilson’s massive stroke in October 1919, which left him bedridden and almost wholly incapacitated for the remainder of his term. His wife Edith essentially served as acting president, “shield[ing] Woodrow from interlopers and embark[ing] on a bedside government that essentially excluded Wilson’s staff, the Cabinet and the Congress.” But, as historian Robert Dallek recounts in his 2010 article “Presidential Fitness and Presidential Lies,” examples are legion. FDR managed to keep the public mostly in the dark about his partial paralysis from polio, aided by camera-snatching Secret Service agents who wouldn’t allow photos of the president in a wheelchair. While pursuing a fourth term in 1944, Roosevelt was “suffering from an enlarged heart and severe hypertension that threatened his life, [and] experienced significant weight loss, headaches, fatigue, and an inability to concentrate for sustained periods of time.” He died 82 days after inauguration. “In running for reelection under these circumstances,” Dallek writes, “FDR committed a terrible ethical breach.”
John F. Kennedy’s aura of vitality and “vigah” depended on deliberate lies about his massive health problems, including the adrenal-gland disorder Addison’s disease, for which he required regular steroid treatments. In 2013, after examining a raft of newly released Kennedy papers, Dallek reported that
“during his presidency—and in particular during times of stress, such as the Bay of Pigs fiasco, in April of 1961, and the Cuban missile crisis, in October of 1962—Kennedy was taking an extraordinary variety of medications: steroids for his Addison’s disease; painkillers for his back; anti-spasmodics for his colitis; antibiotics for urinary-tract infections; antihistamines for allergies; and, on at least one occasion, an anti-psychotic (though only for two days) for a severe mood change that Jackie Kennedy believed had been brought on by the antihistamines.”
Kennedy’s regimen also included a potent cocktail of painkillers and amphetamines regularly administered by celebrity physician Max “Dr. Feelgood” Jacobson; “I don’t care if it’s horse piss, it works,” JFK said of the injections.
Read the rest of this post →Related Tags
This seems as if it ought to be more controversial: yesterday the state of California implemented a COVID-19 “health equity” metric mandating that counties demonstrate that they are investing in “eliminating disparities in levels of transmission” affecting disadvantaged communities, or have already eliminated such disparities, as a condition of being allowed to reopen economic activity any further. Simply achieving a satisfactory overall low rate of transmission will not be enough.
Notice that the rationale for the policy cannot be simply a concern that a county is not truly safe overall so long as it still has any hot spots of higher prevalence. If that were the concern, the straightforward response would be to require a showing of investment in addressing whatever localized hot spots a county might have, no matter what their racial or socioeconomic composition.
Although the current wave of COVID infection in California tends to correlate with poorer and minority communities, we know that over the course of the pandemic many hot spots have emerged in places that were not especially disadvantaged economically — ski resorts, college towns, places with many international business travelers, and so forth. Apparently it’s going to be fine for a county to reopen in California if it’s got localized hot spots in categories like those, so long as its overall countywide numbers are satisfactory.
Writes local reporter Bill Melugin, “The state will incorporate the California ‘Healthy Places Index’ (HPI) into its decision making for county reopenings. The HPI measures numerous things, including two parent households, voting, alcohol availability, retail density, clean air & water, and ‘tree canopy’.” A related map suggests that communities with high property values and income levels, especially those nearer the coast, tend to dominate the ranks of designated healthy communities.
One hopes that what is going on here is not a threat to restrain economic activity that would otherwise be recognized as low-risk as a way of obtaining leverage with which to push counties into “equity” initiatives that go beyond criteria of sound disease control.
Related Tags
Since the death of George Floyd this past May, and in the wake of the national turmoil his death provoked, both Congress and state legislatures have turned their attention to policing reform — and in particular, the doctrine of qualified immunity. At the federal level, four separate bills have been introduced (both by Democrats and Republicans) that would eliminate or substantially modify qualified immunity nationwide. Meanwhile, several states have either passed or are currently considering policing reform that would eliminate or limit qualified immunity for state-level civil rights claims.
Unfortunately, the discussion around qualified immunity is plagued by misinformation. Nearly all of the defenses I’ve seen raised in support of the doctrine display a profound misunderstanding of what qualified immunity actually is and how it works, and I increasingly find that almost all of my public comments on this issue are devoted simply to correcting clear mistakes. Perhaps unsurprisingly, the most common peddler of such misinformation is the law enforcement lobby, which appears to be acting out of a combination of knee-jerk defensiveness and profound ignorance as to qualified immunity reform.
I therefore thought it would be helpful to identify and correct some of the most flagrant misrepresentations of qualified immunity by law enforcement organizations and leaders. The purpose of this catalogue is both to correct the object-level errors on these particular issues, but also to put the public in general, and policy makers in particular, on notice that they should take with a grain of salt any statements about qualified immunity made by the law enforcement lobby. As these examples illustrate, those statements are simply not reliable.
Read the rest of this post →As my Cato colleague Chris Edwards mentioned last week, the Congressional Budget Office on Friday released its annual report on trends in U.S. household income, means-tested transfers, and federal taxes between 1979 and 2017 (the most recent year for which tax data were available). The CBO report is, as usual, chock-full of interesting information, but today I’d like to focus on three findings that challenge common claims regarding taxes, middle class incomes, and wealth redistribution in the United States.
First, and echoing Chris’ post from last week, the CBO shows that total annual federal taxes — income, payroll, corporate, and excise — paid by the richest Americans (households making around $300,000/year or more) have basically doubled since 1979. Over the same period, the middle classes have paid almost the same amount of federal taxes, and the poorest Americans’ federal tax burden has all but disappeared.
Second, the average value of means-tested transfers (cash payments and in-kind benefits from federal, state, and local governments) has increased for all income groups since 1979, but has grown dramatically for lower-income Americans:
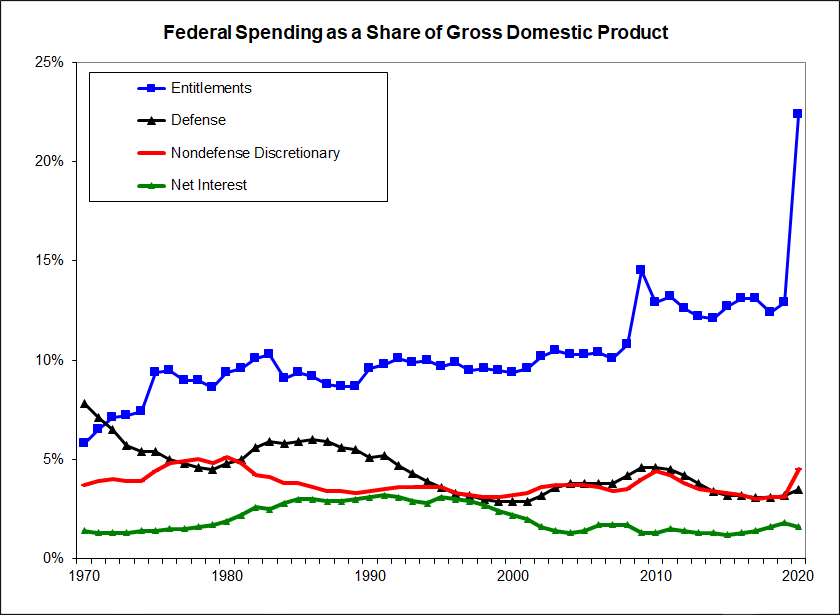
According to the CBO, the significant growth in means-tested transfers between 1979 and 2017 has primarily been driven by (1) expanding eligibility for middle-income groups; and (2) spending on Medicaid (“the largest—and fastest growing—means-tested transfer program”) due to an almost-fivefold increase in enrollees (from about 20 million in 1979 to 94 million in 2017) and an increase in average per capita benefits from $1,700 to $5,500 (in 2017 dollars). This trend, of course, is consistent with other data showing the extent to which entitlements have increasingly consumed federal spending in recent years.
Third, the CBO report shows that both median household incomes and average group incomes have enjoyed real (inflation-adjusted) gains since the early 1980s, with the aforementioned progressivity of the United States’ tax/transfer systems playing a big role.
As shown in Figure 3 above, real median household incomes after taxes and transfers saw a 61.1 percent increase between 1979 and 2017. Importantly, the taxes and transfers analyzed by the CBO once subtracted from middle class market incomes but began to supplement them in the mid-2000s — a trend my colleague Ryan Bourne noted here a few years ago. By 2017, these taxes and transfers added $3300 (7.7 percent) to median market incomes.
Similar trends apply to average incomes:
As Figure 4 shows (click on various groups to highlight or exclude them), the poorest American households’ average incomes bottom out in 1983 and then grow by approximately 95 percent through 2017, aided substantially and increasingly by taxes and transfers. By 2017, in fact, well over half of these households’ annual income comes from the government. Furthermore, an increasing number of American households (on average) became net recipients of government benefits: the bottom two quintiles paid less in federal taxes than they received in transfers every year since 1979 (with total net benefits increasing substantially through 2017), but they were joined in 2002 by third quintile households (with real market incomes starting around $60,000 per year). By 2017, taxes and transfers added $6,300 to this group’s average market income of $61,700 — a 10.2% gain. The net tax/transfer burden in 2017 was also much lower — though still net negative — for the fourth quintile of households than it was in 1979, while the top income group saw only modest relief (paying a slightly smaller share, but larger amount, of income to the government on net) over the same period.
As Bourne noted back in 2017, the CBO data are imperfect — for example, excluding state and local taxes and showing only averages (which can hide costs and benefits that certain taxpayers face). Nevertheless, the CBO’s new report adds to the growing body of empirical literature refuting common myths about middle class incomes and the progressivity of the U.S. system. One can (and in my opinion should) question whether that system is delivering the optimal mix of total wage and non-wage compensation to American workers, or the whether the significant and increasing redistribution that we employ has proven effective. But those questions don’t change the underlying facts presented by the CBO — facts that are light-years away from much of the populist and anti-capitalist hysteria we hear right now.