Over the past few weeks, a number of pernicious myths have popped up regarding the Pentagon’s budget. Here I want to dispel these myths with an exhaustive, and exhausting, look at the details. The charts below, compiled with my colleague Charles Zakaib, should help.
The President’s Budget officially requests $613.9 billion for the Pentagon FY 2013, broken down between $525.4 billion in the Pentagon’s base budget, and another $88.5 billion for Overseas Contingency Operations (OCO)—mainly the war in Afghanistan. This compares to a base budget and OCO of $530.5 billion and $115.1 billion, respectively, for FY 2012. (For other good overviews, see Chris Hellman’s analysis for the National Priorities Project; and Carl Conetta’s “Keeping Pentagon Cuts in Perspective” [.pdf] for the Project on Defense Alternatives).
There are, however, other costs in the budget that should be lumped under the rubric of national defense. For starters, there is about $33 billion in the non-Pentagon portion of what is official classified as “national defense.” Aside from the Pentagon and the wars, that includes the cost of the nation’s nuclear weapons (chiefly within the Department of Energy), and some mandatory spending not captured in the DoD base budget and OCO figures shown above. That brings requested defense spending to $647.4 billion. In addition, as Winslow Wheeler of the Center for Defense Information points out, the Obama administration has requested $137.7 billion for Veterans Affairs, and $46 billion for homeland security (that’s a government-wide total compiled by the Office and Management and Budget, excluding the defense portion). Wheeler also points to another $29.4 billion in military retirement and DoD retiree health care costs (these show up under budget functions 550, 650, and 950). All the items above total about $860 billion.
Americans likely spend even more on things loosely connected to national security. For example, there might be some additional intelligence spending that is not captured in the above numbers. Wheeler suggests that we should also count the International Affairs budget ($69.8 bn), and the DoD’s portion of interest on the debt ($63.7 bn). According to Wheeler’s calculations, the actual “defense” budget proposed for 2013 weighs in at a whopping $994.3 billion.
In the charts below, however, I have chosen to focus solely on the Pentagon’s base budget, excluding the wars, and the various other costs mentioned above that are not counted under the “National Defense” budget function (aka 050 for budget geeks).
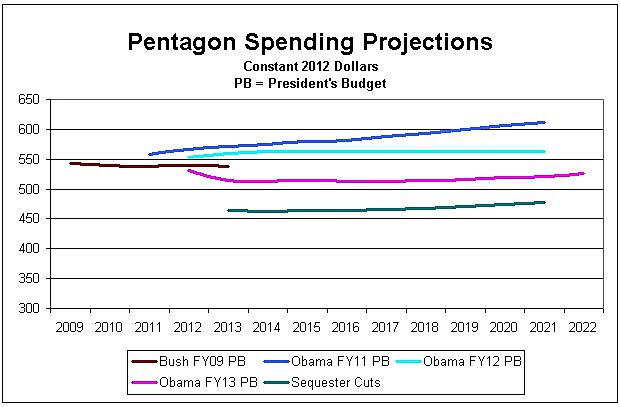
Chart 1 shows different baseline projections for DoD spending, beginning with President Bush’s final budget in FY 2009 (the dark red line). All are shown in constant 2012 dollars. The President’s Budget for FY 2013, the bright pink line, will average $517 billion over the next decade. The ten-year projections from his earlier budget requests for FY 2011 and FY 2012 are shown as dark blue and light blue, respectively. The dark green line shows the budget levels dictated by the sequestration provisions of last year’s Budget Control Act.
At first glance, the changes appear to be quite significant. The administration claims that its budget achieves $486.9 billion in savings by 2021, but that is in nominal dollars, and measured against the FY 2012 baseline. By my calculations, the gap between the top line shown in the chart (FY 2011) and the most recent request accumulates to $667 billion in real, inflation-adjusted savings over nine years.
Either way, it looks as though a lot of money has been shaved off the budget. Taxpayers and deficit hawks should be pleased. The “defending defense” crowd is appalled.
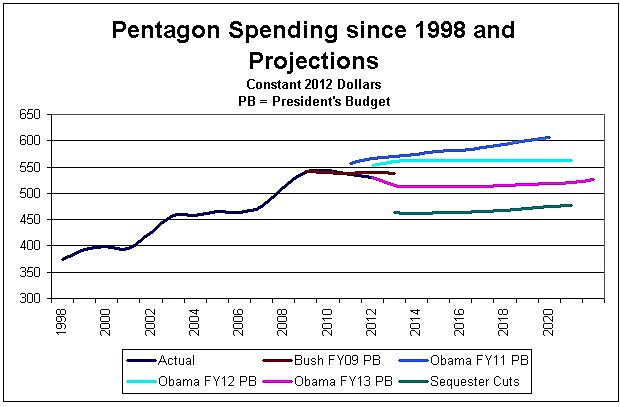
But there is less here than meets the eye (or more, depending on your perspective). The following three charts show how the Pentagon’s base budget compares to the past 15 years, and the past 35 years. In all cases, the figures are shown in constant, FY 2012 dollars.
The first shows that the Pentagon’s budget, according to the Obama administration’s projections, will average $517 billion over the next decade, slightly more than what we spent in 2008 ($511 bn), and 38 percent more than we spent in 1998 ($375 bn).
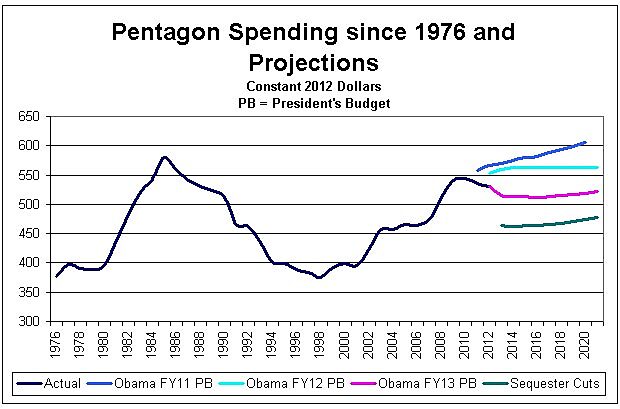
The second chart below displays the new projections in a wider historical context, going all the way back to 1976. We spent, on average, $523 billion during the Reagan Era (1981–1990).
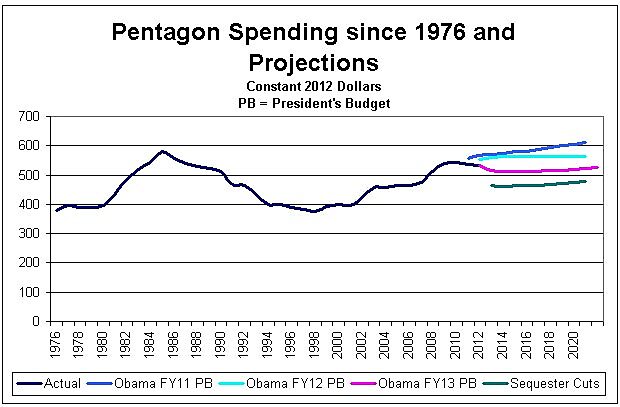
Finally, I have included one chart that shows all of these figures, from 1976 to 2022 against a Y‑axis starting at $0. Starting the axis at $300 billion (as I have done in the other charts in order to differentiate the projected baselines) can produce the visual effect of apparent sharp increases or declines, when in fact most of these have been quite modest.
The bottom line? People may disagree about whether national security threats are more urgent today, and therefore require much more money than we spent in the 1980s to defeat the Soviet Union. For my part, I have long argued we are vastly safer than we were a generation ago. But it isn’t accurate to say that the Pentagon’s budget has been gutted or cut to the bone.
