Whoops! Federal Reserve economists looked in the shoe closet recently and discovered more than half a trillion dollars of government bond debt that they hadn’t previously counted.
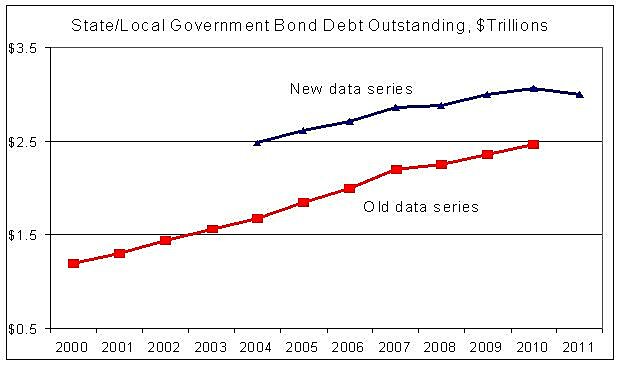
It turns out that state and local governments in the United States are not $2.5 trillion in debt as previously reported, but $3 trillion in debt. That’s $25,000 for every household in the nation. That debt is on top of the trillions of dollars of other liabilities that politicians have piled on us and our kids, including federal bond debt, federal “entitlement” obligations, and state/local pension and health obligations.
The Fed started using a new data vendor for its state/local bond information, and this vendor apparently has more complete coverage of the thousands of state and local government agencies and their debt issuance. (See note 16 here).
The old Fed data (Table D.3) show state/local debt growing from $1.2 trillion in 2000 to $2.5 trillion in 2010. The new data (Table D.3) show debt hitting $3.1 trillion in 2010 and then falling a bit to $3.0 trillion in 2011. By the way, Census data show that state/local government debt grew from $1.5 trillion in 2000 to $2.7 trillion in 2009.
There are two lessons here: 1) State/local debt has risen rapidly over the last decade, adding to the many other burdens that taxpayers will have to deal with in coming years, and 2) While assembled by highly skilled experts, government data (inflation, GDP, income levels, and much else) are not carved in stone.
The chart shows the old debt time series and the new one. The new series includes data only back to 2004.

