I wrote about the Ryan budget two days ago, praising it for complying with Mitchell’s Golden Rule and reforming Medicare and Medicaid.
But I believe in being honest and nonpartisan, so I also groused that it wasn’t as good as the 2011 and 2012 versions.
Now it’s time to give the same neutral and dispassionate treatment to the budget proposed by Patty Murray, the Washington Democrat who chairs the Senate Budget Committee.
But I’m going to focus on a theme rather than numbers.
One part of her budget got me particularly excited. Her Committee’s “Foundation for Growth” blueprint makes a very strong assertion about the fiscal and economic history of the Clinton years.
The work done in the 1990s helped grow the economy, create jobs, balance the budget, and put our government on track to eliminate the national debt.
As elaborated in this passage, the 42nd President delivered very good results.
President Bill Clinton entered office in 1993 at a time when the country was facing serious deficit and debt problems. The year before, the federal government was taking in revenue equal 17.5 percent of GDP, but spending was 22.1 percent of the economy—a deficit of 4.7 percent. …The unemployment rate went from 7 percent at the beginning of 1993 to 3.9 percent at the end of 2000. Between 1993 and 2001, our economy gained more than 22 million jobs and experienced the longest economic expansion in our history.
And the Senate Democrats even identified one of the key reasons why economic and fiscal policy was so successful during the 1990s.
…federal spending dropped from 22.1 percent of GDP to 18.2 percent of GDP.
I fully agree with every word reprinted above. That’s the good news.
So what, then, is the bad news?
Well, Senator Murray may have reached the right conclusion, but she was wildly wrong in her analysis. For all intents and purposes, she claims that the 1993 tax hike produced most of the good results.
President Clinton’s 1993 tax deal…brought in new revenue from the wealthiest Americans and…our country created 22 million new jobs and achieved a balanced budget. President Clinton’s tax policies were not the only driver of economic growth, but our leaders’ ability to agree on a fiscally sustainable and economically sound path provided valuable certainty for American families and businesses.
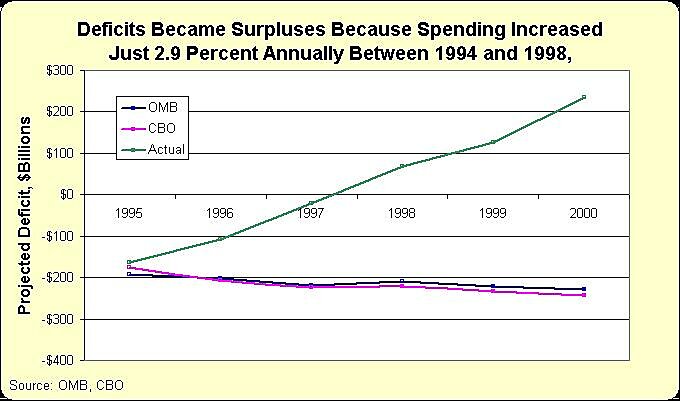
First, let’s dispense with the myth that the 1993 tax hike balanced the budget. I obtained the fiscal forecasts that were produced by both the Congressional Budget Office and the Office of Management and Budget in early 1995 because I wanted to see whether a balanced budget was predicted.
As you can see in the chart, both of those forecasts showed perpetual deficits of about $200 billion. And these forecasts were made nearly 18 months after the Clinton tax hike was implemented.
So if even the White House’s own forecast from OMB didn’t foresee a balanced budget, what caused the actual fiscal situation to be much better than the estimates?
The simple answer is that spending was restrained. You can give credit to Bill Clinton. You can give credit to the GOP Congress that took power in early 1995. You can give the credit to both.
But regardless of who gets the credit, the period of spending restraint that began at that time was the change that produced a budget surplus, not the tax hike that was imposed 18 months earlier and which was associated with perpetual red ink.
But spending restraint tells only part of the story. With the exception of the 1993 tax hike, the Clinton years were a period of shrinking government and free market reform.
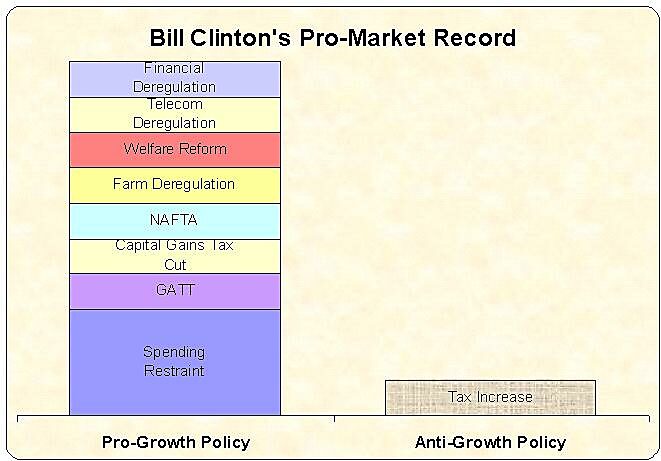
Take a look at my homemade bar chart to compare the good policies of the 1990s with the bad policies. It’s not even close.
You may be thinking that my comparison is completely unscientific, and you’re right. I probably overlooked some good policies and some bad policies.
And my assumptions about weighting are very simplistic. Everything is equally important, with a big exception in that I made the government spending variable three times as important as everything else.
Why? Well, I think reducing the burden of government spending during the Clinton years was a major achievement.
But maybe we shouldn’t rely on my gut instincts. So let’s set aside my created-at-the-spur-of-the-moment bar chart and look at something that is scientific.
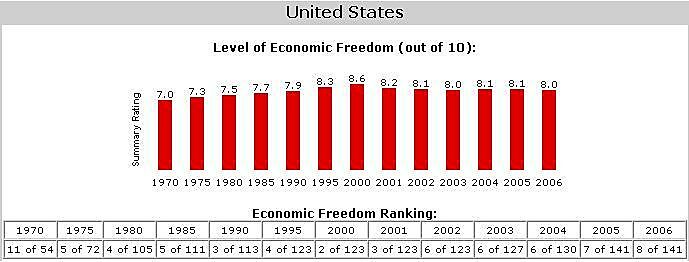
This chart is taken directly from Economic Freedom of the World, which uses dozens of variables to measure the overall burden of government.
As you can see, the United States score improved significantly during the Clinton years, showing that economic freedom was expanding and the size and scope of government was shrinking.
In other words, Patty Murray is correct. She is absolutely right to claim that Bill Clinton’s policies “helped grow the economy, create jobs, balance the budget.”
Now she needs to realize that those policies were small government and free markets.


