Global Science Report is a weekly feature from the Center for the Study of Science, where we highlight one or two important new items in the scientific literature or the popular media. For broader and more technical perspectives, consult our monthly “Current Wisdom.”
—
Atmospheric concentrations of methane (CH4)—a greenhouse gas many times more potent than carbon dioxide (at least over shorter time scales)—have begun rising after a hiatus from 1999–2006 that defied all expectations. No one knows for sure why—why they stood still, or why they started up again.
There is a lot of research underway looking into the causes of the observed methane behavior and at least three new studies have reported results in the scientific literature in the past couple of months.
The findings are somewhat at odds with each other.
In February, a study led by Alex Turner, from Harvard University’s School of Engineering and Applied Sciences, was published that examined methane emissions from the US over the past 10 years or so. The researchers compared observations taken from orbiting satellites to observations made from several sites on the earth’s surface. They reported over the past decade “an increase of more than 30% in US methane emissions.” And this increase was so large as to “suggest that increasing US anthropogenic methane emissions could account for up to 30–60% of [the] global increase.”
However, the methodologies employed by Turner et al. were insufficient for determining the source of the enhanced emissions. While the authors wrote that “[t]he US has seen a 20% increase in oil and gas production and a 9‑fold increase in shale gas production from 2002 to 2014” they were quick to point out that “the spatial pattern of the methane increase seen by [satellite] does not clearly point to these sources” and added that “[m]ore work is needed to attribute the observed increase to specific sources.”
Perhaps most interestingly, Turner and colleagues note that “national inventory estimates from the US Environmental Protection Agency (EPA) indicate no significant trend in US anthropogenic methane emissions from 2002 to present”—a stark contrast to their findings, and a potential embarrassing problem for the EPA. But, never fear, the EPA is on it. The EPA is now actively re-examining its methane inventory and seems to be in the process of revising it upwards, perhaps even so much as to change its previous reported decline in methane emissions to an increase. Such a change would have large implications for the US’s ability to keep the pledge made at the U.S. 2015 Climate Conference in Paris.
However, the Turner et al. results have been called into question by a prominently-placed study in Science magazine just a couple of weeks later. The Science study was produced by a large team led by Hinrich Schaefer of New Zealand’s National Institute of Water and Atmospheric Research.
Schaefer and colleagues analyzed the changes in the isotopic ratios of carbon in the methane contained in samples of air within ice cores, archived air samples, and more recent measurement systems. Different sources of methane contain different mixtures of methane isotopes, related to how long ago the methane was formed. Using this information, the authors developed a model for trying to back out the methane sources from the well-mixed atmospheric samples. Although such a procedure is somewhat tunable (i.e., you can get pretty much any answer you want (kind of like climate models!)), the authors are pretty confident in their final results.
What they determined was that prior to the 1999–2006 hiatus, methane emissions largely bore a chemical signature of fossil fuels. This signal diminished during the hiatus, and has not shown much of an increase since, despite the post-2006 renewed growth in global methane emissions. Instead, Schaefer’s team found a strong chemical signal pointing to biogenic sources of methane being behind the current rise—most pointedly, emissions from agriculture (including both rice paddies and animal husbandry).
Despite the rather surprising nature of this conclusion, the authors are resolute:
The finding of a predominantly biogenic post-2006 increase is robust. Further, it seems likely that fossil-fuel emissions stagnated or diminished in the 1990s. Importantly, they are a minor contributor to the renewed [CH4]-rise. This contradicts emission inventories reporting increases of all source types between 2005 and 2010 with a major (~60%) thermogenic [fossil fuels] contribution… The finding is unexpected, given the recent boom in unconventional gas production and reported resurgence in coal mining and the Asian economy. Our isotope-based analysis suggests that the [CH4]-plateau marks not a temporary suppression of a particular source but a reconfiguration of the CH4-budget. Either food production or climate-sensitive natural emissions are the most probable causes of the current [CH4]-increase. These scenarios may require different mitigation measures in the future.
It is very hard to reconcile the results of Schaefer et al. with those of Turner et al.
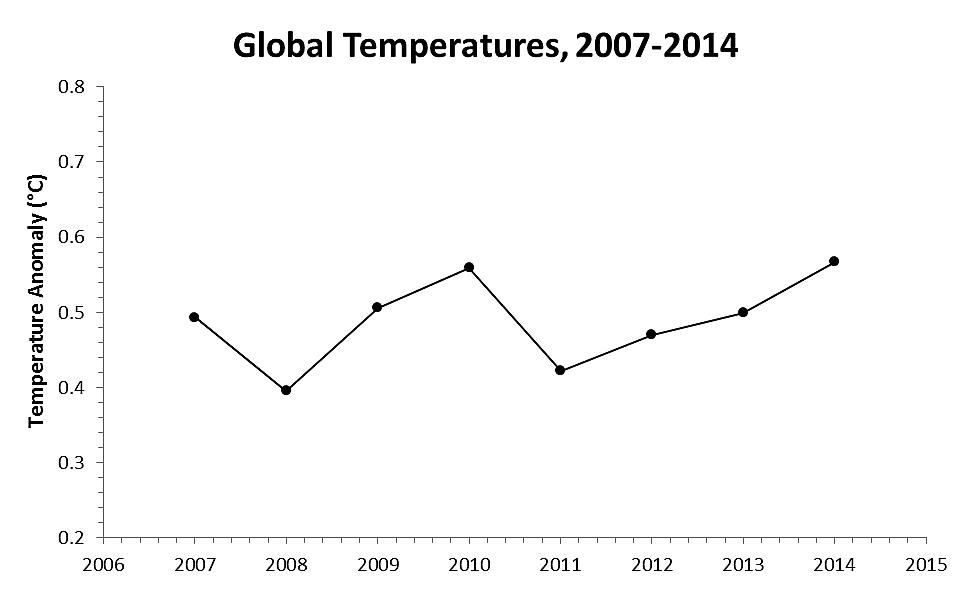
Also disturbing is the glib statement on “climate-sensitive natural emissions.” Attention, Schaefer et al.: Your study covers from 2007 through 2014. The figure below shows annual global surface temperature departures from an arbitrary mean. There is no climate change to be “sensitive” to during this period. Further, the statement is at odds with much of the text of the article, which largely points to an anthropogenic biogenic source for the change. One can’t help but wonder if some crusading reviewer insisted on the climate statement as the price for publication. Such a thing happened to one of us (Michaels) as a condition for publication in the prestigious “EOS—Transactions of the American Geophysical Union” many moons ago, despite the fact that the paper in question specifically determined such a link was not the case.
And, to keep things interesting, a paper was published just days after the Schaefer et al. Science piece, by a team of researchers led by Petra Hausmann of Germany’s Karlsruhe Institute of Technology. These researchers investigated the growth in atmospheric methane concentrations alongside the growth in atmospheric ethane concentrations –a tracer for methane emission from fossil fuels. By analyzing the increase in ethane, Hausmann et al. concluded that about half of the growth in methane emissions between 2007 and 2014 came from fossil fuel sources correlated to the oil and natural gas fracking boom in the U.S. In their press release, they note that their result fits with the Turner et al. results of a significant increase in US methane emissions and contrasts with the US EPA estimates. The authors also note the discrepancy with the Schaefer et al. findings.
Pretty clearly, no one knows quite what is going on.
And into this confusion, the EPA has decided (no doubt from the President’s urging) to issue regulations pertaining to the allowable amount of methane emissions from US oil and gas recovery and delivery operations—in the name of mitigating future climate change.
As we pointed out when the regulations were first announced, the impact on future climate change is so tiny as to be immaterial. And now, with the great uncertainty as to what exactly is behind the recent rise in atmospheric methane concentrations, the EPA’s regulations may not only be insignificant, but wrong-headed as well.
What is certain, is that if you don’t understand the cause of a situation, taking steps to “fix” it is probably a bad idea. The Obama Administration’s “While under debate, regulate!” mantra is a poor operating protocol destined to fail. Or worse.
References:
Hausmann, P., R. Sussmann, and D. Smale, 2016. Contribution of oil and natural gas production to renewed increase in atmospheric methane (2007–2014): top–down estimate from methane and methane column observations. Atmospheric Chemistry and Physics, 16, 3227–3244, doi:10.5194/acp-16–3227-2016.
Schaefer, H, et al., 2016. A 21st century shift from fossil-fuel to biogenic methane emissions indicated by 13CH4. Science, doi:10.1126/science.aad2705.
Turner, A.J., et al., 2016. A large increase in US methane emissions over the past decade inferred from satellite data and surface observations. Geophysical Research Letters, doi: 10.1002/2016GL067987.
