You Ought to Have a Look is a feature from the Center for the Study of Science posted by Patrick J. Michaels and Paul C. (“Chip”) Knappenberger. While this section will feature all of the areas of interest that we are emphasizing, the prominence of the climate issue is driving a tremendous amount of web traffic. Here we post a few of the best in recent days, along with our color commentary.
—
In this week’s You Ought to Have a Look, we’re going to catch up on some new climate science that hasn’t gotten the deserved attention—for reasons soon to be obvious.
First up is a new study comparing climate model projections with observed changes in the sea ice extent around Antarctica.
While everyone seems to talk about the decline in the sea ice in the Northern Hemisphere, considerably less discussion focuses on the increase in sea ice in the Southern Hemisphere. If it is mentioned at all, it is usually quickly followed by something like “but this doesn’t disprove global warming, it is consistent with it.”
But, even the folks delivering these lines probably realize that the latter bit is a stretch.
In fact, the IPCC and others have been trying downplay this inconvenient truth ever since folks first started to note the increase. And the excuses are getting more involved.
A new study pretty much exposes the emperor.
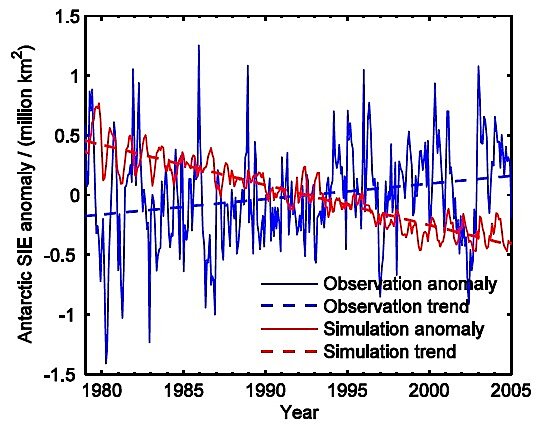
A team of three Chinese scientists led by Qi Shu compared the observed trends in Southern Hemisphere sea ice extent (SIE) with those projected by the collection of climate models used to forecast future climate changes by the U.N.’s Intergovernmental Panel on Climate Change (IPCC). In a nutshell, they found increases in sea ice around Antarctic were not consistent with human-caused climate change at all—or at least not by how climate models foresee it taking place. Figure 1 shows the extent of the mismatch—rather shocking, really.
Figure 1. Comparison of observed (blue) and mean climate model projected (red) changes in Antarctic sea ice extent (from Shu et al., 2015).
Shu et al. write:
The linear trend of satellite-observed Antarctic SIE is 1.29 (±0.57) x 105 km2 decade-1; only about 1/7 [climate] models show increasing trends, and the linear trend of [multi-model mean] is negative with the value of ‑3.36 (±0.15)x105 km2 decade-1.
This should pretty much quell talk that everything climate is proceeding according to plan.
For all the details, be sure to check out the full paper (which is open access).
The next paper worth having a look at is one that examines the impact of urbanization on thunderstorm development in the southeastern U.S.
Recall that a global warming talking point is greenhouse gas-induced climate change will result in more episodes of intense precipitation.
As with all manner of extreme weather events, the association is far from being so simple. All sorts of confounding factors impact the observed changes in precipitation and make disentangling and identifying any impact from anthropogenic global warming nearly impossible. We have discussed this previously, and this new research provides more such evidence.
A team of researchers led by Alex Haberlie developed a method of locating “isolated convection initiation” (ICI) events from historic radar data. ICI events are basically thunderstorm kickstarters. Examining 17 years of data for the region around Atlanta, the team found:
Results reveal that ICI events occur more often over the urban area compared to its surrounding rural counterparts, confirming that anthropogenic-induced changes in land cover in moist tropical environments lead to more initiation events, resulting thunderstorms and affiliated hazards over the developed area.
In other words, pointing to increases in thunderstorms and declaring greenhouse gas emissions the culprit is overly simplistic and potentially misleading.
The full details are available here, although they are behind a paywall. But even a read of the abstract will prove enlightening. Turns out climate change is not so simple.
And finally, as the number of people shivering from cold in the Eastern U.S. increases, so, too, does the effort to link the cold to global warming—mostly through feedback from declines in Arctic sea ice.
While we have been over this before—the linkages are less than robust—we’re always happy to see new research on the topic.
Just published is a paper by University of Washington’s Dennis Hartmann that examines the causes behind last winter’s brutal cold in the eastern U.S. Instead of a link to sea ice and high latitude conditions, he found tropical sea surface temperature (SST) anomalies in the Pacific Ocean were a driving force behind the cold air outbreaks last winter. Hartmann further notes as of his writing the paper (in January 2015) the same conditions present last winter persisted into this one. The current situation bears this out.
This passage from Hartmann’s paper bears repeating and is worth keeping in mind:
This result is consistent with a long history of observational and modeling work indicating that SST anomalies in the extratropics are strongly driven by atmospheric circulation anomalies, while SST anomalies in the tropics can strongly force the atmospheric circulation.
In other words, while extratropical circulation drives our daily weather, tropical sea surface temperature patterns drive the circulation. Thus, don’t look to the Arctic to explain winter’s weather, but rather the Tropics. Hopefully, John Holdren etc. will take this to heart.

