You Ought to Have a Look is a feature from the Center for the Study of Science posted by Patrick J. Michaels and Paul C. (“Chip”) Knappenberger. While this section will feature all of the areas of interest that we are emphasizing, the prominence of the climate issue is driving a tremendous amount of web traffic. Here we post a few of the best in recent days, along with our color commentary.
—
We sign in this week with a look at how this year’s global temperature is evolving as the big Pacific El Niño begins to wane. The temporary rise in global temperature that accompanies El Niño events is timed differently at the surface than it is in the lower atmosphere. Thus, while El Niño-boosted warmth led to a record high value in the 2015 global average surface temperature record, it did not fully manifest itself in the lower atmosphere (where the 2015 temperatures remained well below record levels).
But now that warmth is being fully felt aloft. The figure below is the satellite-measured global average temperature history of the lower atmosphere as compiled from the University of Alabama-Huntsville (UAH). The El Niño-spiked temperatures are clearly obvious in the first four months of 2016 (the rightmost points in the graph).
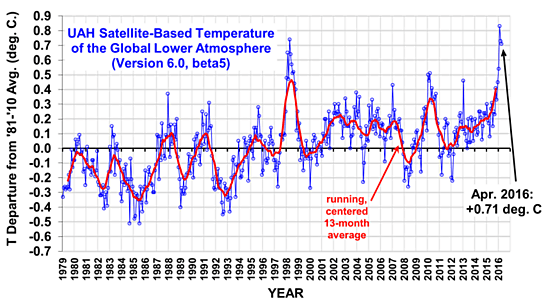
Figure 1. Global average satellite-based temperatures of the lower atmosphere from January 1979 through April 2016, as compiled by researchers at the University of Alabama-Huntsville.
Dr. Roy Spencer, who along with Dr. John Christy, curates the UAH satellite temperature record, has this to say on his blog regarding what to expect for the rest of the year and how the 2016 annual temperatures may ultimately rank:
I expect average cooling to continue throughout the year as El Nino weakens and is replaced with La Nina, now expected by mid-summer or early fall. Nevertheless, 2016 could still end up as a record warm year in the satellite record…it all depends upon how fast the warmth from the El Nino dissipates and La Nina sets in.
Early indications are also that global average surface temperature are continuing to feel the effect of the big, but dying, El Niño, and remain elevated into record territory.
So, it won’t be too surprising to be reading headlines the end of the year screaming “2016 Hottest Year Ever”—but it’s probably too much to hope that the authors of the underlying story correctly attribute the cause. But, we’re sure their memory will be jogged, and they’ll be full of excuses, when the La Nina cooling sets in and post-El Nino temperatures drop below record levels in 2017 (and likely many years thereafter).
Next up is a quick look at the updated numbers from the United Nations in regards to just how much global greenhouse gas emissions will be impacted if all nations of the world abide by the emissions reductions scheduled promised in their Intended Nationally Determined Contributions (INDC) that they submitted under the Paris Climate Agreement. There is only a slim possibility that these schedules will be adhered to—for instance, in the U.S., all indications are that we overpromised. Unkept promises aside, the U.N. reports that total global emissions of greenhouse gases will be 55.0 Gt (Metric gigatons) CO2eq (equivalent emissions scaling all greenhouse gas absorption to the value for carbon dioxide) in 2025 and 56.2 GtCO2eq in 2030.
In the figure below, we superimpose those expectations on the U.N.’s Intergovernmental Panel on Climate Change (IPCC) depictions of business-as-usual (“baseline”) projections described by the IPCC as “projections of GHG [greenhouse gas] emissions and their key drivers as they might evolve in a future in which no explicit actions are taken to reduce GHG emissions.” It should be clear from this graph, that, as we have been fond of saying all along, the sum total of all the INDCs under the Paris Climate Agreement amounts to little more than business-as-usual expectations. But now, to make it look like everyone is “doing something” about climate change, the expected evolution of economic systems is being rebranded as “climate action.” Maybe that makes everyone feel better. In reality, only the US and the EU have proposed significant (and significantly expensive) reductions.
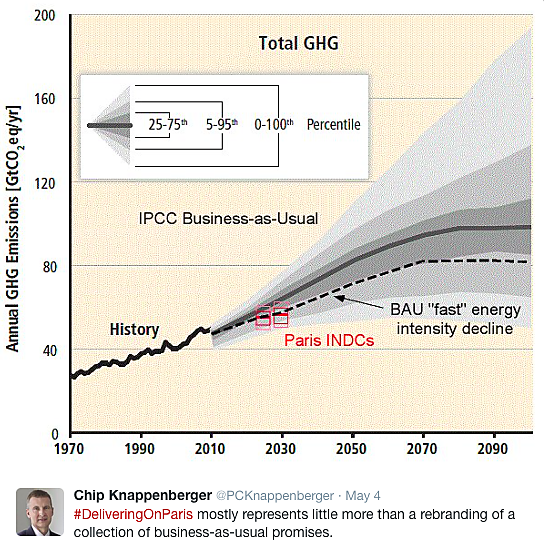
Figure 2. Greenhouse gas emissions expected under the Paris Climate Agreement (red) superimposed upon IPCC business-as-usual expectations.
Next we turn to an enlightening piece by a team of analysts at the Mercatus Center at George Mason University examining the cumulative cost of government regulations—and it isn’t pretty. They calculate that that federal regulations retard economic growth in the U.S. by about 0.8% per year—or to the tune of a GDP that is $4 trillion less in 2012 than it would have been absent new regulation imposed since 1980, adding that “[i]f the cost of regulatory accumulation were a country, it could have the 4th largest GDP in the world.” Here is an excerpt from the summary:
Using a 22-industry dataset that covers 1977 through 2012, the study finds that regulation—by distorting the investment choices that lead to innovation—has created a considerable drag on the economy, amounting to an average reduction in the annual growth rate of the US gross domestic product (GDP) of 0.8 percent.
Federal regulations have accumulated over many decades, piling up over time. When regulators add more rules to the pile, analysts often consider the likely benefits and compliance costs of the additional rules.
But regulations have a greater effect on the economy than analysis of a single rule in isolation can convey. The buildup of regulations over time leads to duplicative, obsolete, conflicting, and even contradictory rules, and the multiplicity of regulatory constraints complicates and distorts the decision-making processes of firms operating in the economy. Firms respond to both individual regulations and regulatory accumulation by altering their plans for research and development, for expansion, and for updating equipment and processes. Because of the important role innovation and productivity growth play in an economy, these distortions have consequences for the growth of the economy in the long run.
Economic growth in the United States has, on average, been slowed by 0.8 percent per year since 1980 owing to the cumulative effects of regulation:
● If regulation had been held constant at levels observed in 1980, the US economy would have been about 25 percent larger than it actually was as of 2012.
● This means that in 2012, the economy was $4 trillion smaller than it would have been in the absence of regulatory growth since 1980.
● This amounts to a loss of approximately $13,000 per capita, a significant amount of money for most American workers.
The gory details are provided in the full report authored by Bentley Coffey, Patrick A. McLaughlin, and Pietro Peretto.
And, finally, before signing off, we want to make sure that if you are looking for rational looks at the allegations of climate change-driven catastrophes in the news this week, you’ll know where to find them. Here is a good story from the A Chemist in Langley blog that throws water on the claims that anthropogenic climate change is behind Canada’s Ft. McMurray fire, and here’s some good background from the New Orleans Geological Society on the myriad of non-climate forces behind the drowning Isle de Jean Charles (telling the story that the New York Times didn’t).
You ought to have a look!
