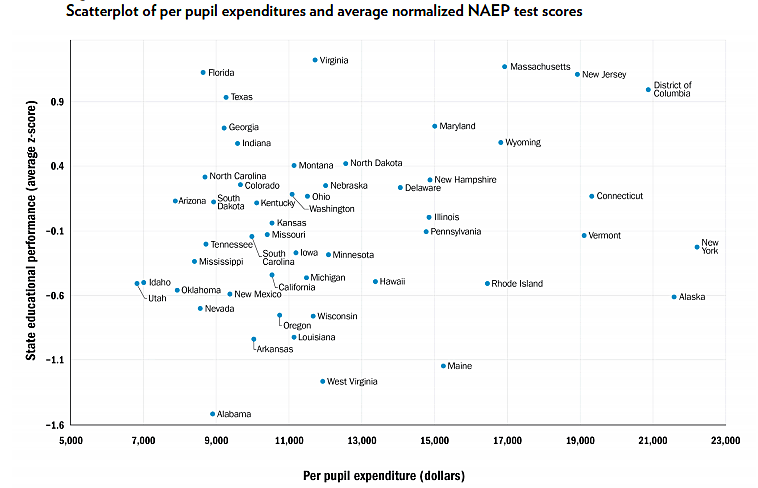
If you pay state and local taxes or have kids in public schools, you will want to check out this recent Cato study on education spending and education results. Looking across the states, the study by Stan Liebowitz and Matthew Kelly found no significant relationship between per-pupil spending and student performance when you adjust for state cost of living.
The starting point is the National Assessment of Education Progress (NAEP) scores, which measure student knowledge of various subjects in grades 4, 8, and 12. The scores are used in various media articles on school quality, such as those by U.S. News and World Report.
Liebowitz and Kelly argue that the basic NAEP results are flawed as a measure for comparing public schools across states because they are not adjusted for state demographic differences. So, for example, Texas ranks 35th on aggregated NAEP data and Iowa ranks 17th, but the demographics of the two states are quite different. As it turns out, generally, white children in Texas score higher than white children in Iowa, Hispanic children in Texas score higher than Hispanic children in Iowa, and so on for other groups.
The authors adjust for state demographic differences and produce their own school quality scores. Using these scores, Texas moves up to 6th place and Iowa moves down to 32nd.
The chart shows the authors’ quality score on the vertical axis and per-pupil spending in nominal dollars on the horizontal axis. Consider that students in many states score higher than students in New York yet those states only spend half of what New York does. Compare Florida, Texas, and Virginia to New York, for example.
Further analysis by the authors looks at spending adjusted for state cost of living.

