Last week, I jumped into the surreal debate about whether Obama has been the most fiscally conservative president in recent history.
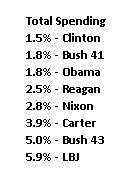
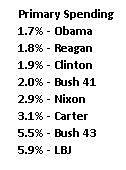
I sliced the historical data from the Office of Management and Budget a couple of ways, showing that overall spending has grown at a relatively slow rate during the Obama years. Adjusted for inflation, both total spending and primary spending (total spending minus interest payments) have been restrained.
So does this make Obama a fiscal conservative?
And how can these numbers make sense when the President saddled the nation with the faux stimulus and ObamaCare?
Good questions. It turns out that Obama’s supposed frugality is largely the result of how TARP is measured in the federal budget. To put it simply, TARP pushed spending up in Bush’s final fiscal year (FY2009, which began October 1, 2008) and then repayments from the banks (which count as “negative spending”) artificially reduced spending in subsequent years.
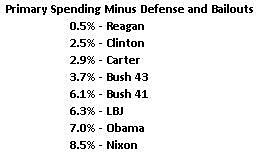
The combination of those two factors made a big difference in the numbers. Here’s another table from my prior post, looking at how the presidents rank when you subtract both defense and the fiscal impact of deposit insurance and TARP.
All of a sudden, Obama drops down to the second-to-last position, sandwiched between two of the worst presidents in American history. Not exactly a ringing endorsement.
But this ranking is incomplete. At that point, I was trying to gauge Obama’s record on domestic spending, and the numbers certainly provide some evidence that he is a stereotypical big-spending liberal.
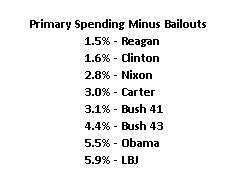
But the main debate is about which president was the biggest overall spender. So I’ve run through the numbers again, and here’s a new table looking at the rankings based on average annual changes in inflation-adjusted primary spending, minus the distorting impact of deposit insurance and TARP.
Obama is still in the second-to-last position, but spending is increasing by “only” 5.5 percent per year rather than 7.0 percent annually. This is obviously because defense spending is not growing as fast as domestic spending.
Reagan remains in first place, though his score drops now that his defense buildup is part of the calculations. Clinton, conversely, stays in second place but his score jumps because he benefited from the peace dividend after Reagan’s policies led to the collapse of the Soviet Empire.
Let’s now look at these numbers from a policy perspective. Rahn Curve research shows that government is far too big today, so the goal of fiscal policy should be to restrain the burden of government spending relative to economic output.
This means that policy moves in the right direction when government grows more slowly than the private sector, as it did under Reagan and Clinton.
But if government spending is growing faster than the productive sector of the economy, as has been the case during the Bush-Obama years, then a nation eventually will become Greece.


