Must come down. Of course, we’re referring to lower atmospheric temperatures measured by satellites.
For months we have been saying that, once they started dropping, the satellite temperatures—our only truly global measure—were going to go down with a vengeance, which is what usually happens after a strong El Niño event spikes a fever. El Niño is a dramatic slowdown (or even a reversal) in the trade winds that diverge surface water away from the South American coast, “upwelling” much colder subsurface waters. When that stops, global temperatures rocket upwards, but that also builds up more and more cold water to be unleashed when the trade winds resume.
If the 1998 El Niño is any guide, global temperatures are going to be back in (or near) “pause” mode by by the turn of the year.
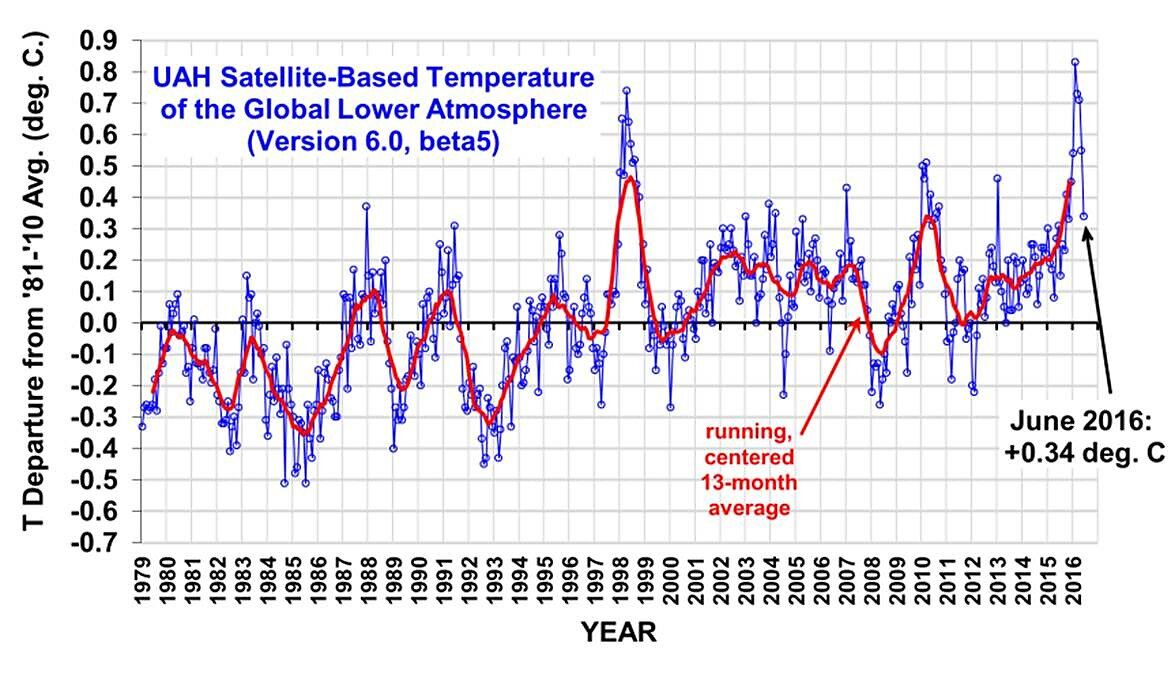
According to University of Alabama-Huntsville’s Roy Spencer, who publishes the satellite data, the drop in the last two months was the second-largest in the entire record, missing the record by only 0.01⁰C. That record was set—not surprisingly—in the decline after the slightly bigger 1997–8 El Niño. In the tropics, where El Niño is most expressed, the drop was the largest in the entire 37-year record.
For what it’s worth, no one knows what the ultimate cause of an El Niño is. While they are the largest secular oscillation in global surface temperatures, computer models for global warming can’t simulate them realistically, and even short-term (year in advance) forecasting models are pretty lousy when it comes to initiating one.
Despite the recent peak, the satellite data never lost the “pause” that began in 1996. As far as the surface temperatures go, recent adjustments that “disappeared” that pause are looking more and more suspect as other independent data (like the satellites) do not corroborate them. Stay tuned for more, as we have just submitted an article on this problem.
