Before President Trump and Republicans cut taxes in December, the federal budget deficit was projected to be $689 billion in 2019 and rising to $1 trillion by 2022, according to CBO. The tax cut will add about $280 billion to the deficit in 2019 but declining amounts after that.
Now Congress has agreed to a budget-busting spending bill that will add roughly $180 billion to outlays in 2019 and push the deficit well over $1 trillion that year.
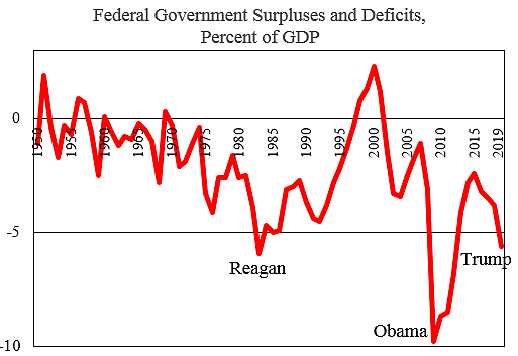
The chart shows budget deficits as a share of gross domestic product (GDP) since 1950. President Obama was the Deficit King, presiding over a deficit in 2009 that almost hit 10 percent of GDP. President Reagan presided over a deficit of 5.9 percent of GDP in 1983.
If Trump signs the current spending bill, he will likely be the third president in modern history to preside over a deficit as huge as 5 percent of GDP. For the chart, I’ve used CBO’s June economic forecast, but newer projections may show higher GDP for this year and next.
Look at the chart. Abstract from the short-term fluctuations, and draw a long-term trend line in your mind. Scary huh?
What do we do about this mess? Cato’s Ryan Bourne has a new study out soon on adding new budget rules to restrain spending in Washington.
