Global Science Report is a weekly feature from the Center for the Study of Science, where we highlight one or two important new items in the scientific literature or the popular media. For broader and more technical perspectives, consult our monthly “Current Wisdom.”
Carbon dioxide regulations promulgated by the EPA are based upon the assumption that they will actually do something about climate change in the U.S., and that the rest of the world, which had been needling the U.S. for decades of inaction, will now follow our virtuous lead.
Neither is going to happen.
This Report is based upon just-released data from the U.S. Energy Information Administration showing that the amount of carbon dioxide emitted from the U.S in the last year was the about the same as was emitted in 1994—nearly two decades years ago. During that time, emissions grew steadily for 14 years, peaking in 2007, and then fell dramatically (Figure 1). The emissions in 2012 were 12% less than those of 2007.
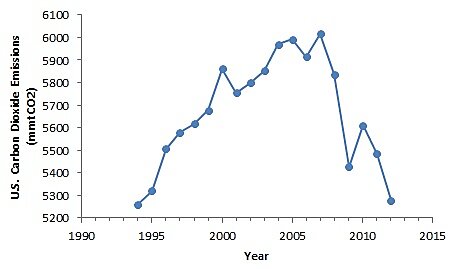
Figure 1. U.S. annual carbon dioxide emissions, 1994–2012 (data source: U.S. Energy Information Administration).Given this non-trivial decline in carbon dioxide emissions, let’s see how the government’s assumptions are holding up.
Assumption 1: Reducing U.S. carbon dioxide emissions will do something about global warming-related weather/climate impacts in the U.S.
The U.S. National Oceanic and Atmospheric Administration (NOAA) compiles the number of “Billion Dollar Weather/Climate Disasters” in the U.S. The higher this number is the more media attention they get and the more global-warming-is-making-the-weather-worse-and-we-must-immediately-act-to-stop-it furor it engenders.
With U.S. emissions on the decline, so too, certainly, are the number of billion dollar weather disasters, right?
Figure 2 shows the annual tally of the number of billion dollar “disasters.” Despite the rapid U.S. emissions decline for the past 5 years, the number of weather disasters in the U.S. is increasing.
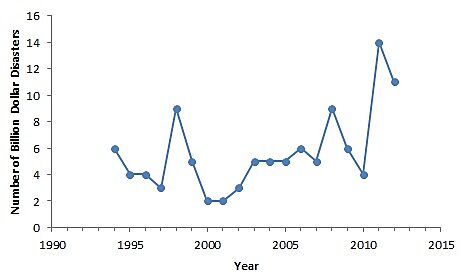
Figure 2. Number of billion dollar weather/climate disasters in the U.S., 1994–2012 (data compiled by the U.S. National Oceanic and Atmospheric Administration).There are two primary reasons why this is the case. The first is that the number of people and the amount of stuff that we all have continues to increase (i.e., there is more stuff in harm’s way), and the second, there is no relationship between U.S. carbon dioxide emissions and extreme weather events in the United States. U.S. emissions could have been zeroand the result would have been even worse—because rebuilding infrastructure in the extremely expensive energy economy that would ensue would cost much, much more.
Assumption 2: The rest of the world will follow our lead and reduce emissions.
As we like to point out, the magnitude of future global warming (and accompanying climate change) rests not on the future carbon dioxide emissions pathway of the U.S., but rather on that taken by the rest of the world. In the typical mid-range emissions scenario employed by the UN’s Intergovernmental Panel on Climate Change (IPCC), the amount of warming projected to occur between 1990 and 2095 is 2.8°C (5.0°F). Of this amount, only about 0.2°C (0.38°F)—about 7%—is expected to result from U.S. emissions. Big deal.
Further, these forecasts are likely way too high. We’ve experienced 0.33°C of warming since 1990, or about 12% of the forecast total, even as 22% of the forecast period is has already passed.
So then why is there so much focus by President Obama on regulations aimed at reducing U.S. carbon dioxide emissions when they will result in no meaningful climatic consequence?
Because our emissions declines are supposed to set an example and other nations of the world will follow suit.
That’s not happening, either.
Figure 3 shows the carbon dioxide emissions from the rest of the world over the same time period as the U.S. emissions in Figure 1. When U.S. emissions increased 14% from 1994–2007, emissions from the rest of the world increased. When U.S. emissions then declined 12% from 2007–2012, emissions from the rest of the world increased even faster.
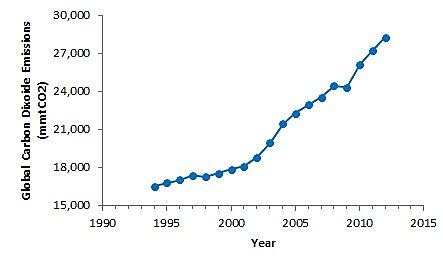
Figure 3. Global (less U.S.) annual carbon dioxide emissions, 1994–2012 (data source: U.S. Energy Information Administration updated through 2012 according to Peters et al., 2013).Why? Because the emissions growth in the rest of the world is primarily being driven by China and other developing countries that are more interested in growing their economies then they are in emulating the U.S.
All which has to make you wonder. As the data show that the premises upon which U.S. greenhouse gas regulations have been promulgated are wrong, why do we persist with such silly notions?
Reference:
Peters, G.P., et al., 2013. The challenge to keep global warming below 2°C. Nature Climate Change, 3, 4–6, doi:10.1038/nclimate1783.
