USA Today headline says, “Inflation rate surges as CPI data shows prices rose 6.8% in November, the fastest spike since 1982.”
That 6.8% figure does not describe what happened this November at all. It measures what happened at some points in time between the brutal pandemic of 2020 (when U.S. deaths from COVID-19 rose from 908 on November 1 to 2,389 by November 30) and the much safer and stronger global economy of November 2021.
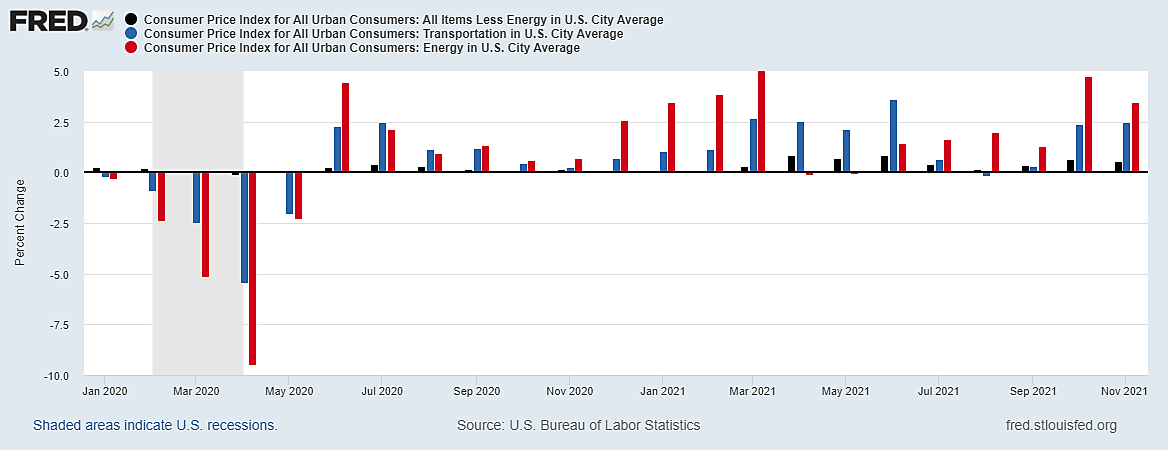
To find a record “spike” in November, we must look at monthly data, not 12-month changes. The graph highlights monthly changes in three categories:
- Energy, which has relative importance (weight) of 7.5% in the CPI, rose by 3.5% in a single month. And that counts only direct energy costs such as gasoline, fuel oil, natural gas, and electricity. It does not count the indirect effects of higher energy costs on the costs of transportation (of people or products) by air, ship, trains, trucks, and buses. And it does not count the indirect costs of higher energy costs on energy-intensive products such as grain, cattle and chicken, grain, aluminum, ethanol, paper, and plastics.
- Transportation, which has a weight of 16.9% rose by 2.5% in November alone. As argued above, both wholesale and retail transportation costs are heavily affected by rising prices for oil, natural gas, and coal (which move together globally due to substitution), and electricity derived from these fuels. In addition to such obvious items as airline fares, transportation includes used cars u
- CPI less energy, which accounts for 92.5% of the total CPI though often a comparatively minor share of monthly changes. Although this excludes direct energy prices (the missing 7.5%), it includes transportation and other expenses (such as petrochemicals in fabric, paint, and drugs) that are strongly impacted by changes in the price of oil and related energy sources. Since services
Services accounted for 74.6% of the private U.S. economy in the second quarter, but that includes many business services not included in the consumer price index. Transportation and energy services are already included in those bars in the graph. Other important private services in the non-energy CPI include medical care prices which were up 0.2% in November (and 2.1% year-to-year), recreation which was down 0.2%, and education and communication services whose prices were unchanged.
One technical problem with even monthly CPI numbers is that the traditional CPI uses fixed weight, while the Fed’s preferred PCE deflator uses variable chain weights. The traditional fixed-weight CPI was up 0.8% in November and 0.9% in October. But an alternative chain-weighted CPI was up only 0.5% in November, and 0.8% in October. Chain-weighted indexes like the PCE deflator are considered more accurate because, as the BLS explains, they account for “substitution that consumers make across item categories in response to changes in relative prices.”
The much larger elephant-in-the-room problem with year-to-year changes, like the one in the USA Today headline, is that year-to-year spikes in the CPI follow year-to-year spikes in crude oil prices remarkably closely. But large crude oil spikes (such as the 273% year-to-year oil price increase this April) are usually temporary, which means the year-to-year CPI changes likewise come down if and when the oil price comes down.
This may prove important for future inflation reports because the price of West Texas Intermediate Crude Oil peaked near $83 a barrel on October 27 and averaged over $79 in November before falling to $67–70 in early December. That could change, of course, but the direction is always uncertain.
