The Los Alamos National Laboratory has posted a new study, as reported this week by the Washington Post and the Los Angeles Times, that finds that the strain of the novel coronavirus that emerged in Europe and has spread to much of the world is different than the strain of the virus at its origin in China. Those findings are consistent with our research which we posted (in Russian) on April 15, 2020. Although we are not epidemiologists, we are posting our slightly updated analysis below in English in the interest of sharing what may be significant findings with a wider audience. We welcome the scrutiny and consideration of the epidemiology community and hope that our analysis and any corrections or critiques to the below will help advance our knowledge.
From a microbiological point of view, there are several varieties of the SARS-CoV‑2 coronavirus. But from the epidemiological point of view, the world is dealing with two distinctly different supertypes of the coronavirus – the so called “East Asian” and “European” ones.
1. Microbiological approach
In recent months, microbiologists, virologists, phylogenetics, and specialists in other fields of biological sciences have been carrying out unprecedented work to understand the mutation process of the coronavirus and track down new varieties appearing over time. According to recent data, several thousands of its genetically different variants have already been discovered. Based on genomic data available from the Gisaid initiative database the participants of the international research network nextstrain.org were able to discover 10 basic types of SARS-CoV‑2 strains or clades: A1a, A2, A2a, A3, A6, A7, B, B1, B2, B4.
We combine the first six strains, referred to also as clades (A1a, A2, A2a, A3, A6, A7) into one supertype/superclade “A” and the remaining four types (B, B1, B2, B4) – into the supertype/superclade “B”. These two new superclades based on phylogenetic data from Gisaid and nextstrain.org perfectly correspond to “European” and “East Asian” supertypes that we (the authors) define independently from Gisaid and nextstrain.org. As of April 17, 2020, samples of SARS-CoV‑2 from the database represent 59 countries.
The most complete database of SARS-CoV‑2 coronavirus genomic samples allowed researchers to create, in almost real time, a “portrait” of the evolutionary tree of the coronavirus with distinct features for all 10 basic clades of the SARS-CoV‑2.

They have also put them on a geographical map.

There are several parameters in the interaction of coronavirus with humans. Their quantitative values allow one to identify noticeable differences between “East Asian” and “European” supertypes.
2. Stages of the epidemic
The current epidemics started with the “East Asian” type of coronavirus. The first official manifestation of the disease was the case registered in Wuhan on December 1, 2019. According to the South China Morning Post that saw the PRC government’s documents, the first one was a 55-year-old patient who fell ill on November 17, 2019.
During the first 57 (or 42) days of the epidemic – from November 17, 2019 (or from December 1, 2019) till January 12, 2020 – cases of coronavirus infection were registered only within China. Therefore, this first period of the spread of infection can be called Chinese.
Between January 13 and February 1, 2020, the virus from Wuhan was detected in another 25 countries – Thailand, Japan, South Korea, Taiwan, Cambodia, the Philippines, Hong Kong, Singapore, Vietnam, Malaysia, India, Sri Lanka , Nepal, UAE, Australia, Canada, USA, UK, France, Spain, Italy, Germany, Sweden, Finland, and Russia. In other words, during these 20 days, the virus was able to conquer on average 1.3 new countries per day. By the end of this period, 10 East Asian countries accounted for 73.5% of the total number of all cases in the world (without China). Therefore, the second period in the spread of infection can be called East Asian.
On February 1, in a seemingly non-stopping offensive campaign of the coronavirus, a pause suddenly occurred, which lasted almost three weeks – until February 20. After quickly capturing a number of countries, the virus seemed to “fall asleep”. During this almost three-week pause, only two isolated infections occurred (one each – in Belgium and Egypt). This third period can be called a Global pause. During this period, the proportion of East Asian cases of infection in the global total (excluding China) increased to 85.1%, European – decreased from 13.2 to 8.1%.
Global pause in the spread of coronavirus, February 2020

This Global pause in the geographical advancement of coronavirus remarkably coincides with the significant upward shift in the average number of accumulated mutations that happened exactly during the same period in February.

Genomic epidemiology of novel coronavirus — Global subsampling
The pause in the coronavirus attack stopped on February 20. On this day, Iran announced the appearance of the first two patients. Two days later, on February 22, at distances of thousands of kilometers from each other, three epidemic explosions occurred almost simultaneously: in Qom, Iran, in Lombardy, Italy, and in Seattle, USA.
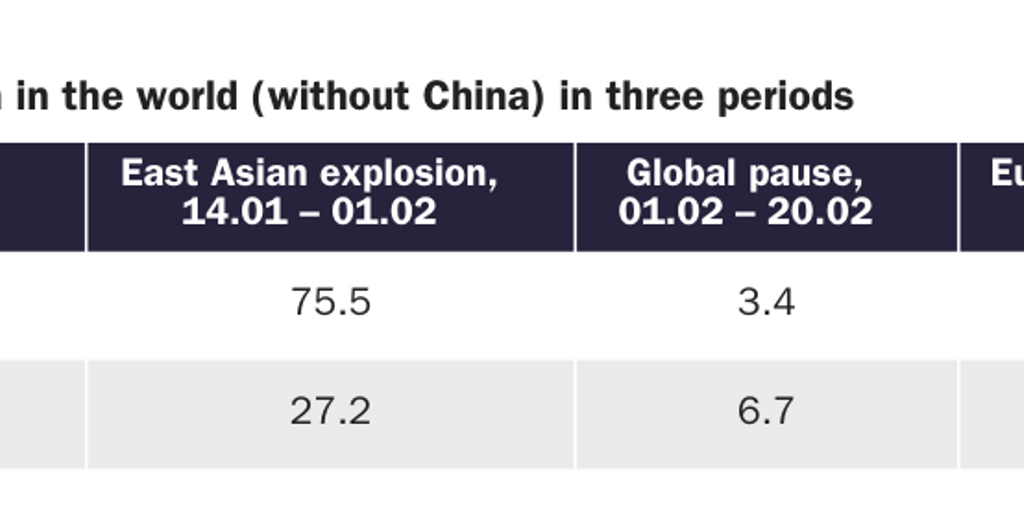
In the following days and weeks, Europe became the main focus of the onset of coronavirus. The European share of the global number of cases (excluding China) increased from 6.4% on February 22 to 55.5% on March 21. Therefore, one can say that on February 20 the fourth period of the epidemic – the European explosion – began, which then quickly turned into a global pandemic.
The enormous duration (by epidemic standards) and the so far unexplained pause in the international spread of the virus that lasted almost three weeks allows one to separate two clusters of explosive epidemic behavior from each other and, therefore, distinguish four main periods of the pandemic:
1) Chinese: November 17, 2019 (December 1, 2019) – January 12, 2020;
2) East Asian explosion: January 13 – February 1, 2020;
3) Global pause: February 2 – 19, 2020;
4) European explosion: since February 20, 2020, quickly turned into a Global pandemic.
3. Changes in geography
Epidemic eruptions that began on February 20–22 in Iran, Italy and the United States marked the beginning of a new period qualitatively different from the previous periods that have been characterized by a relatively “gradual” spread of disease.
First, the number of countries affected by the epidemic has sharply increased. In the 19 days of the Global pause period the number of countries affected by the epidemic increased by only two, in the next 19 days at the stage of the European explosion it increased by 79.
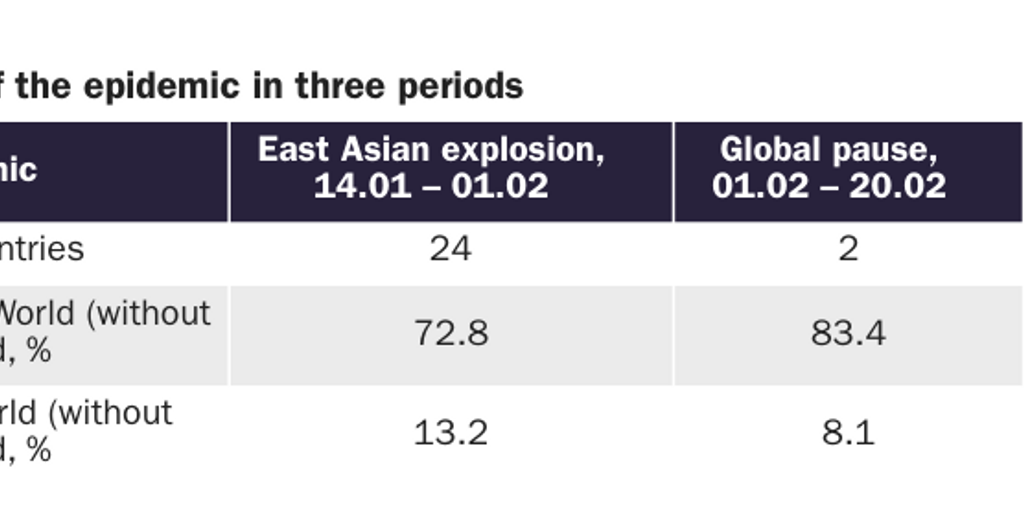
Second, the geographical center of the pandemic has moved from East Asia to Europe. During the 19 days of the Global pause, the share of East Asia in the total number of cases in the world (without China) increased from 72.8 to 83.4%. But during the first 19 days of the European explosion period it fell to 26.5%. At the same time, over the next 19 days of the European explosion stage, the share of Europe in the total number of cases in the world (without China) grew from 8.1 to 42.8%.
4. The speed of spread
During the fourth period of the epidemic – the European explosion – the spread of infection has radically increased. The value of the basic reproductive coefficient (R0), determined according to Chinese data at 2.2, in Europe amounted to 4.0 in the first weeks of the explosion and then reached in some cases 5.7.
During the 19 days of the Global pause from February 1 to February 20, the total number of cases of coronavirus infection in the world (without China) increased 3.4 times (the average growth rate was 6.7% per day). Then, in the next 19 days of European explosion (from 20 February to March 10), it increased 63 times (the average daily growth rate grew to 24.4%).
5. Different behavior of the “old” and “new” types of viruses
The fact that after an almost three weeks’ Global pause, in addition to the “old” version of the coronavirus, its “new” type arrived in Europe, became noticeable in changes of all quantitative characteristics of its interaction with humans. In eight European countries (UK, France, Spain, Italy, Germany, Sweden, Finland, Belgium), in which the first cases of the “East Asian” type of coronavirus were registered before February 4, the spread of infection from February 20–22 has radically accelerated.
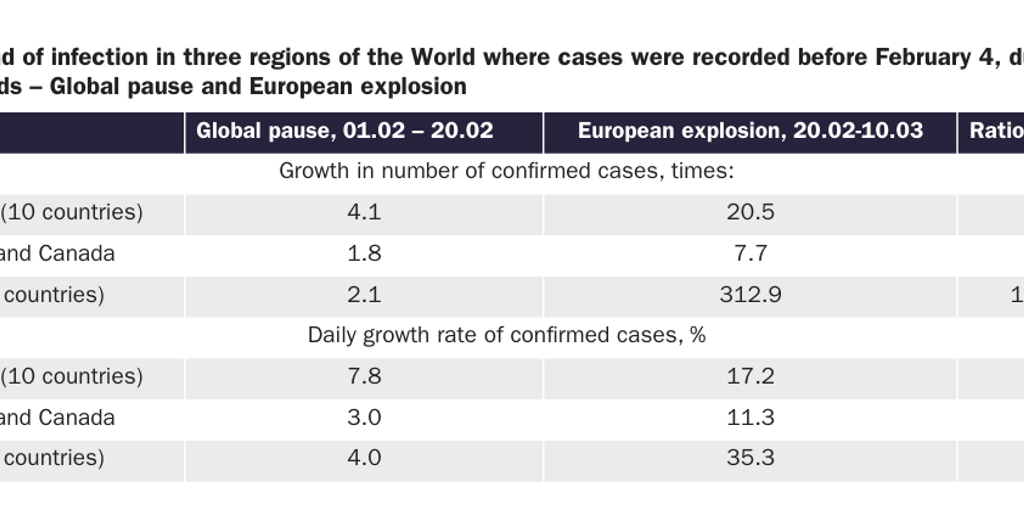
In 19 days of the Global pause, the number of cases in Europe increased by 2.1 times, then in the next 19 days of the European explosion – it grew by almost 313 times. At the Global pause stage, the average growth rate of cases in Europe was 4% per day, then in the next 19 days it reached more than 35% per day.
At the same time, in 10 East Asian countries (Thailand, Japan, South Korea, Taiwan, Cambodia, the Philippines, Hong Kong, Singapore, Vietnam, Malaysia) the spread of infection during the European explosion stage did not occur at such a catastrophic rate as in Europe. Naturally, the spread of coronavirus infection has increased in this region, too, but not as dramatically as in European countries. The number of cases in East Asia increased by 20.5 times, but not 313 times as in Europe.
It should be noted that in Australia and Canada–countries that by most of their social, economic, political, even genetic characteristics are closer to Europe than to East Asia–the increase in the number of infections at the Global pause stage was similar to that of all three regions. But at the European explosion stage, the increase in Australia and Canada was similar only to the East Asian version, and indeed was even slower than in East Asia.
At the Global pause stage, the number of infections has increased:
in East Asia – by 4.1 times,
in Australia and Canada – by 1.8 times,
in Europe – by 2.1 times.
At the European explosion stage, the number of infections has increased:
in East Asia – by 20.5 times,
in Australia and Canada – by 7.7 times,
in Europe – by 312.9 times.
The visible change in the “paradigm” of their response to the epidemic when moving from one stage to another in Australia and Canada did not happen because on February 20–22, 2020, these two societies simultaneously, as if on command, changed their European type-susceptibility to a coronavirus infection to that of the, East Asian type-susceptibility. Obviously, such a change in susceptibility did not occur.
The solution to this riddle might be the following.
At the stage of the East Asian explosion, the East Asian supertype of coronavirus spread to 27 countries of the first wave (25 countries until February 1, plus Belgium and Egypt a few days later).
At the Global pause and a European explosion stages, this supertype of coronavirus continued to dominate in all three regions – in East Asia, Australia, Canada, and Europe.
But at the stage of a Global pause, a new type of coronavirus penetrated Europe and during the ensuing European explosion, it ousted its predecessor. This new type of coronavirus appears to significantly differ from its older relative in many of its quantitative characteristics – rates of spread, incidence, mortality, and lethality. Then this European supertype of coronavirus spread from Europe to some other regions of the world.
6. Quantitative characteristics of the two supertypes of coronavirus
The behavior of two supertypes of coronavirus can be observed in the spread of infection in two large parts of the world – in East Asia and in the rest of the world. The following graph shows 143 countries that simultaneously satisfy two criteria:
1) they registered 100 or more cases of infection;
2) they have at least 28 days since the beginning of the stage of the epidemic explosion.
The horizontal axis on the graphs shows calendar dates, the vertical axis shows the number of cases per 1 million inhabitants.
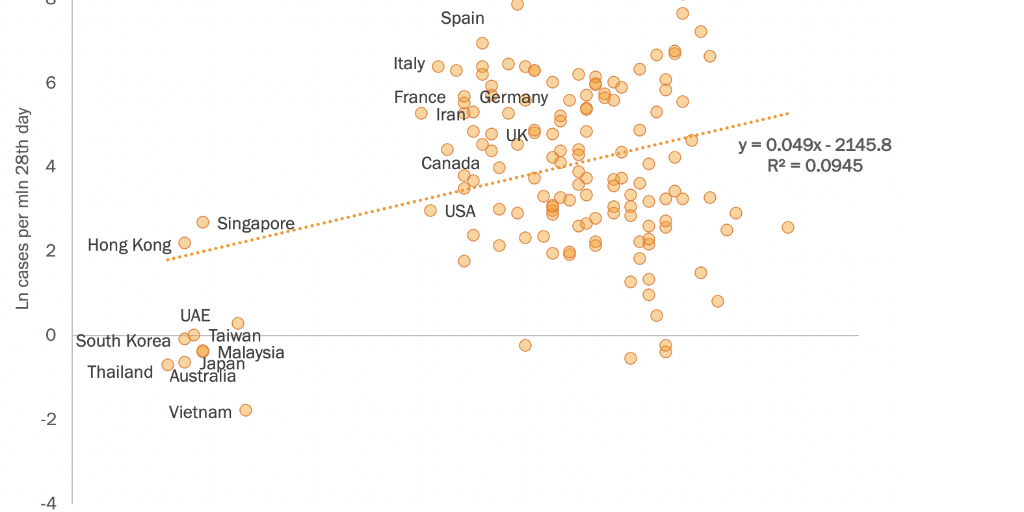
As can be seen from the graphs above, there is a wide gap in time (from January 31 to February 19) between these two groups of countries – “expanded East Asia” (which includes, in addition to proper East Asian countries, Australia and the UAE as well) and the Rest of the world, separating the start of the epidemic explosion stages in countries of one group from the beginning of the explosion stage in countries of another.
In the countries of “expanded East Asia” (together with Australia and the UAE), the explosion stages began between January 21 and 30.
In the countries of the Rest of the world group the explosion stages began on February 20.
In no country in the world did the explosion stage start between January 31 and February 19.
Why this global pause occurred in the evolution of the epidemic and why it persisted for almost three weeks, remain open questions.
Graphically, the difference in the evolution of morbidity and mortality rates in these two groups of countries can be seen in the following pictures.
Morbidity and Mortality per 1 million population in two groups of countries since the start of explosion
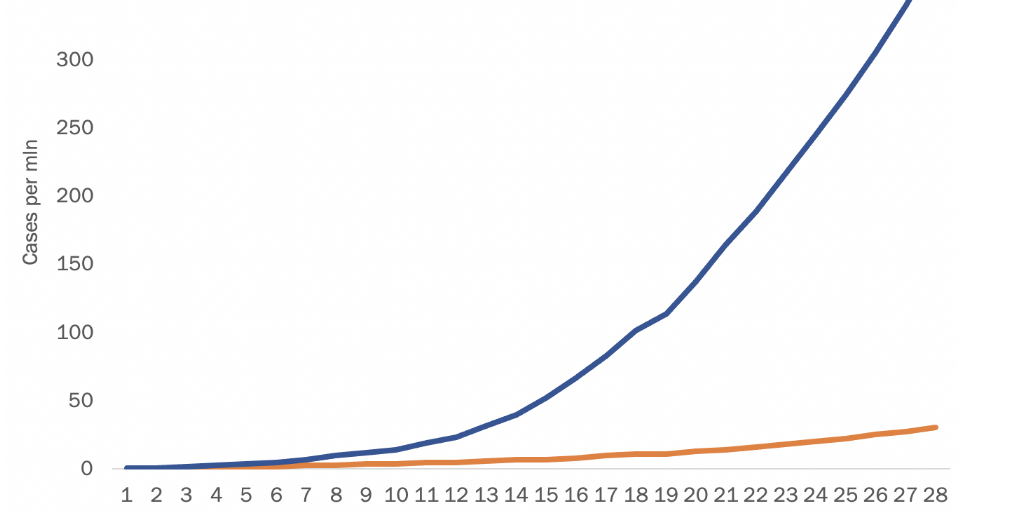
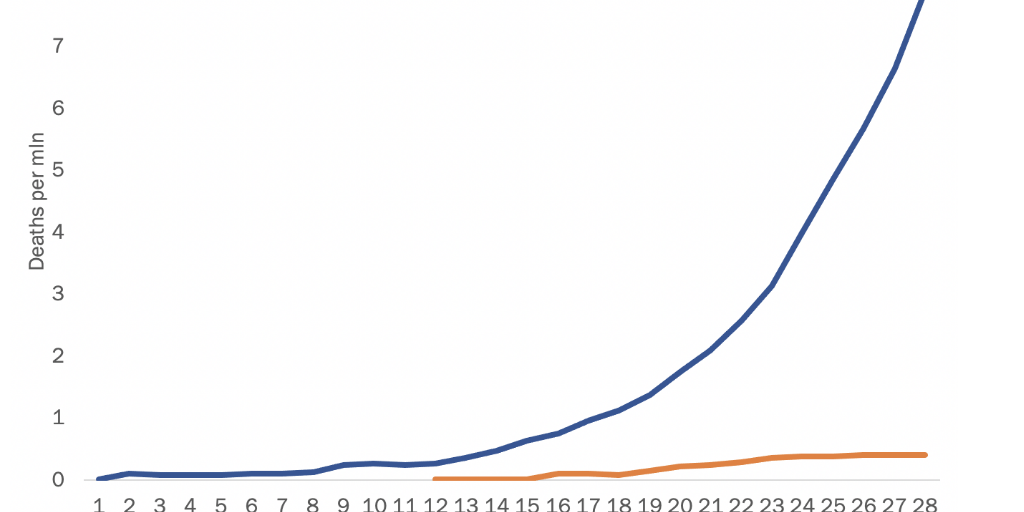
As one can see, the gaps in morbidity and mortality rates per 1 million inhabitants between two groups of countries under the influence of two supertypes of coronavirus is huge. Moreover, it also rises.
The main quantitative indicators of the impact of two supertypes of coronavirus on humans can be summarized in the following table (calculated for 58 countries for which genome data of samples is available and that does not include China).
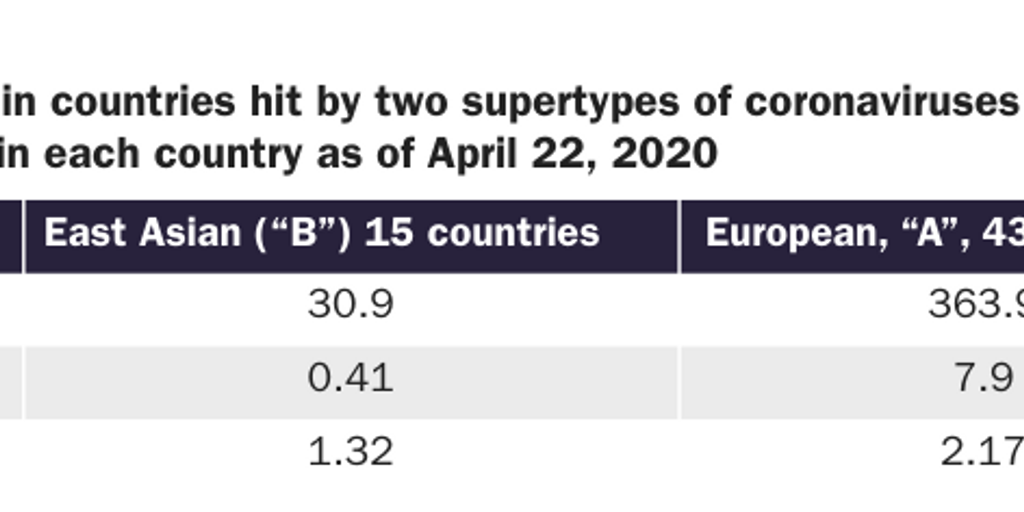
One can see that the morbidity and mortality rates in the countries with two supertypes of coronavirus markedly differ. On the 28th day of the explosion stage, the European supertype of coronavirus, compared to the East Asian one leads to higher levels in morbidity rate – on average by 11.7 times, in mortality rate – by 19 times, in lethality rate – by 64%.
Since each of these groups of countries turns out to be very diverse in composition (because they include countries with different geographical, social, economic, political indicators, with very different populations by their genetical, biological, and medical features, with markedly different government responses to the epidemic), such significant quantitative differences between them can be explained by the nature of the infection itself, by existence of two different supertypes of coronavirus.
It should be emphasized that both supertypes of infection are deadly. But their difference from each other lies in the fact that the second type of infection has significantly higher rates of morbidity, mortality and lethality compared to the first one.
7. Preliminary findings
Several conclusions might be derived from the above considerations.
First, for the society and authorities of each country, it is necessary to correctly identify what type of coronavirus they are faced with.
Second, the social and political reaction to epidemics caused by different types of coronaviruses cannot be the same for each type. Measures that have successfully proven themselves in the fight against a relatively “milder” epidemic may prove to be completely inadequate and unsuitable in resisting a “harsher” epidemic.
Third, a comparison of the effectiveness of public measures and epidemiological outcomes independent of the coronavirus supertype that afflicts the country, makes little sense. It may be like comparing a runny nose with cholera.
In view of the above, the effectiveness of certain anti-epidemic measures should be analyzed within the same group of countries hit by a particular supertype of coronavirus. Since most European countries and the north-eastern part of the United States have been harshly hit by the so-called “European” supertype of coronavirus (superclade “A”), it makes sense to evaluate the effectiveness of anti-epidemic measures in them in comparison first of all with each other.
Natalya Pivovarova is director of the Institute of Economic Analysis in Moscow.
