President Donald Trump will lay out some of his budget priorities in an address to Congress tonight. He wants to increase spending on defense, a border wall, and perhaps infrastructure. He also wants to cut taxes and balance the budget, yet does not favor reductions to Medicare or Social Security. His budget chief, Mick Mulvaney, faces a challenge in meshing all those priorities.
The chart shows federal spending in four categories as a percent of gross domestic product (GDP). No doubt, Mulvaney is pondering the CBO baseline projections to the right of the vertical line for 2018–2027. As a share of GDP, entitlement and interest spending are expected to soar, while defense and nondefense discretionary spending are expected to fall. Below the chart, I discuss the ups and downs of the four categories since 1970.
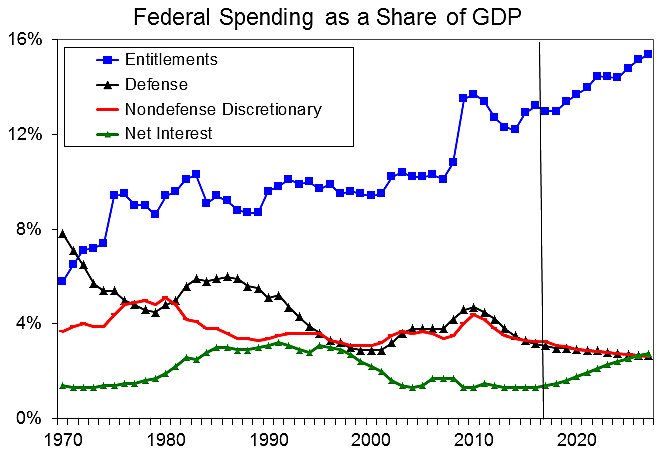
Here are some of the causes of the fluctuations seen in the chart:
1970s: Defense spending plunges as the Vietnam War subsides in the early 1970s. But the cost of new Lyndon Johnson/Richard Nixon entitlement and discretionary programs skyrockets.
1980s: Ronald Reagan boosts defense spending, and interest costs soar due to the rising debt. But Reagan cuts numerous discretionary and entitlement programs. For example, “income security” programs fall from 1.6 percent of GDP in 1981 to 1.1 percent by 1989.
1990s: The end of the Cold War prompts large defense cuts. But the recession and spendthrift approach of George H.W. Bush causes other spending to rise early in the decade. Bill Clinton lucks out as Social Security spending falls from 4.4 percent in 1992 to 4.0 percent by the end of the decade, while spending on Medicare and Medicaid remains fairly flat.
2000s: Medicare spending soars under George W. Bush, partly due to his Part D drug plan. Bush also pushes up spending on defense, homeland security, food stamps, education subsidies, and other programs. However, Bush benefits from the Fed’s policy of low interest rates, which moderates federal interest costs.
2010s: The recession of 2007 to 2009 causes spending on entitlements—such as unemployment insurance and food stamps—to soar. The Obama stimulus package includes big increases for many discretionary and entitlement programs in 2009 and subsequent years. The early Obama years also include high levels of Iraq and Afghanistan war spending. However, Obama also benefits from the Fed’s interest rate policies.
2018–2027: CBO projections show entitlement and interest costs rising rapidly, and deficits topping $1 trillion by 2023. To sustain economic growth and avert a fiscal disaster, Trump should push to terminate and privatize programs in every federal department. He talks a good game, but we will see whether he is interested in actual budget reforms in coming weeks as he rolls out specific proposals.
Notes: CBO data is here. I adjusted the entitlement line to take out TARP from 2009–2011 because it ended up costing taxpayers little or nothing.
For ways to cut federal spending, see this essay at DownsizingGovernment.org.
