The Obama administration ramped-up and sustained interior immigration enforcement operations through the end of FY2013, which was the longest such period of sustained enforcement in U.S. history. President Obama inherited an expanding immigration enforcement apparatus and built on it further by making “Secure Communities” mandatory in near every county of the United States, appointing immigration enforcer and former-Arizona governor Janet Napolitano as the head of DHS, and treating Central American asylum-seekers in a heartless fashion.
Immigration restrictionist groups and some of President Obama’s supporters hid or excused the fact that President Obama’s interior enforcement operations were so extensive. The restrictionists argued that President Obama’s deportation numbers were puffed up to include those captured at the border. Their argument contained just enough truth to pass a 10-second investigation but ignored the fact that ICE removals from the interior of the United States were higher for a longer period under Obama than for any other President (Figure 1).
Figure 1
ICE Removals from the Interior of the United States
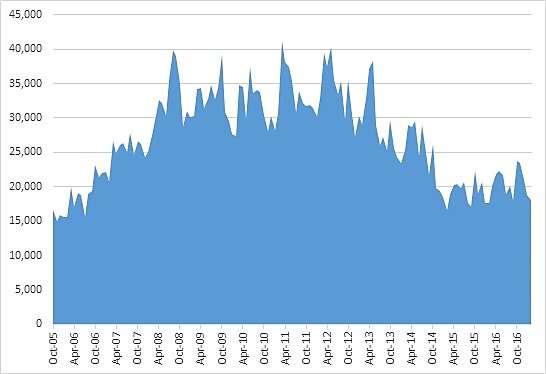
Source: ICE FOIA Library.
Although the Obama administration did sustain a high number of removals, it also focused more on criminals (Figure 2). The latter category included those who committed victimless crimes, like immigration violations, as well as real crimes like violent and property offenses. In January 2016, 53 percent of those removed by ICE were criminals compared to just 33 percent when Obama first took office in January 2009 (Figure 3). In March 2017, the last month for which I have full data, criminals were 59 percent of all removed immigrants. Trump’s deportation priorities haven’t affected that yet.
Figure 2
ICE Removals from Interior of the United States by Criminality
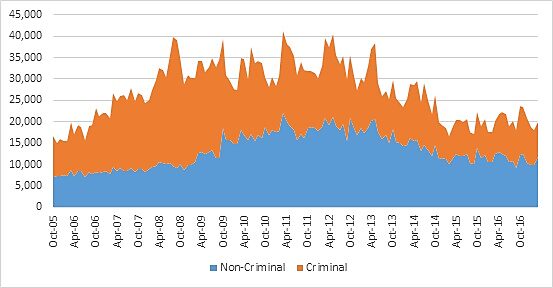
Source: ICE FOIA Library.
Figure 3
Criminal ICE Removals from the Interior of the United States
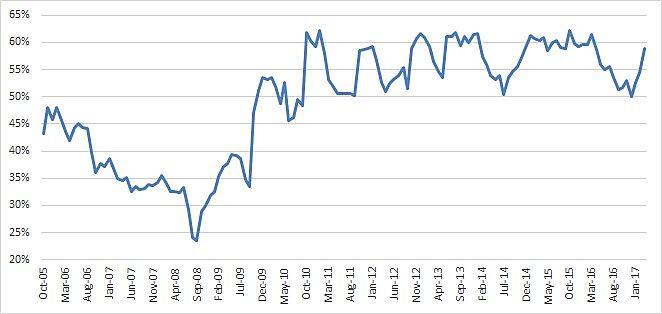
Source: ICE FOIA Library, author’s calculations.
It is difficult to judge the Trump administration’s removal record after less than a year in office. After all, reorienting the enforcement priorities of a bureaucracy as large as the Department of Homeland Security takes time. However, a few facts do stand out.
First, ICE arrests are up dramatically during the Trump administration.
Second, ICE removals from the interior of the United States are down since February 2017. Obama’s ICE deported 21,705 people per month from the interior of the United States from October 2016 through the end of January 2017, before Trump took office. However, President Trump has managed, so far, to deport an average of only 17,142 people per month – 21 percent below Obama’s record for the first four months of the fiscal year. The February-September 2017 removal number is 14.6 percent lower than for the same period in 2016 (Figure 4).
Figure 4
ICE Removals from the Interior of the United States, Monthly Average from April-October 2017.
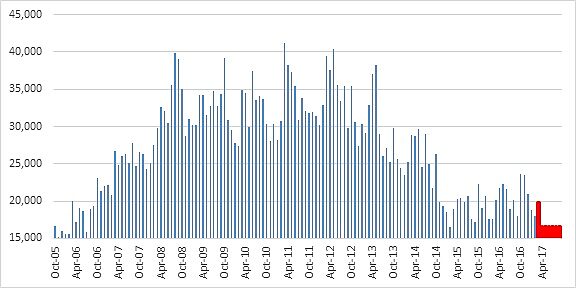
Sources: ICE FOIAs, Washington Post, and Author’s Calculations.
The number in Figure 4 is estimated from the number of deportations by September 9, 2017, extended for an additional three weeks until the end of the fiscal year. That simple exercise estimates that ICE will deport about 223,953 people by the end of the fiscal year. Interior removal numbers are publicly known for the months of October 2016 through March 2017 thanks to FOIAs, so estimating the average number of monthly deportations after March was simply based on the total number of deportations that year.
Third, the immigration court backlog is getting worse. The extension of due process rights to immigrants, an insufficient number of judges, and executive actions have all certainly contributed to the slowdown. Regardless, the number of new arrests and Trump administration efforts to clear the backlog will lead to a substantial rise in deportations from the interior of the United States. Indeed, it may already be occurring but the numbers are hidden by the monthly averages from April through October 2017.
