Today, the Department of Homeland Security (DHS) released a report detailing deportations (henceforth “removals”) conducted by Immigration and Customs Enforcement (ICE) during the fiscal year of 2017. This post presents data on removals in historical context combined with information from Pew and the Center for Migration Studies.
ICE deported 81,603 illegal immigrants from the interior of the United States in 2017, up from 65,332 in 2016. Removals from the interior peaked during the Obama administration in 2011 at 237,941 (Figure 1). ICE also removed large numbers of people apprehended at the border. Since 2012, border removals have outnumbered those from the interior of the United States.
Figure 1
Interior and Border Removals by ICE, 2008–2017
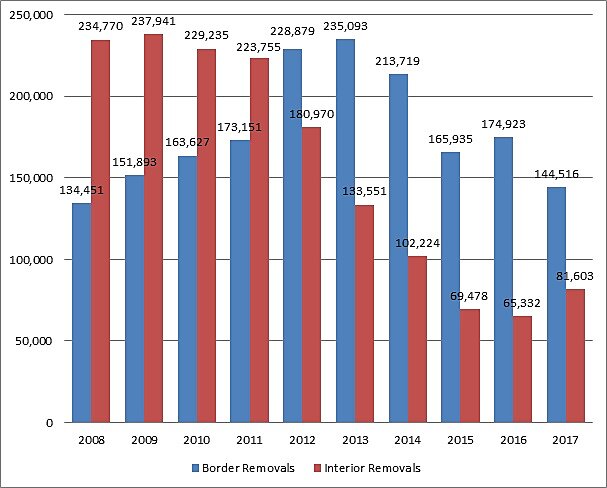
Source: Immigration and Customs Enforcement.
The Obama administration removed 1,242,486 from the interior of the United States during its full eight years, averaging 155,311 removals per year. Data from the earlier Bush administration are more speculative but they show more deportations under Obama than under Bush.
The percentage of all illegal immigrants removed from the United States is a better measure of the intensity of interior enforcement than the total numbers removed (Figure 2). Based on estimates of the total size of the illegal immigrant population from Pew, the Center for Migration Studies, and my own guesstimates for 2016 and 2017, 0.74 percent of that population was removed from the interior of the United States in 2017, up from 0.59 percent in 2016 but still below the 2014 percentage. Interior removals as a percent of the illegal immigrant population peaked at 2.11 percent in 2009.
Figure 2
Removals as a Percent of the Illegal Immigrant Population
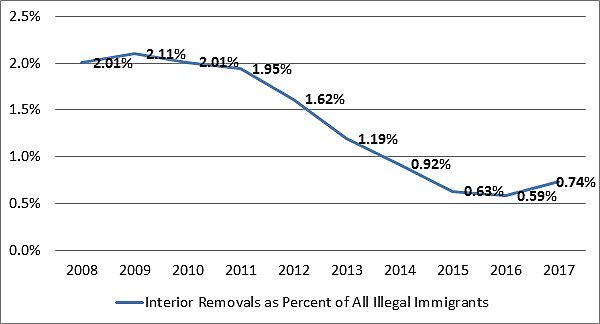
Sources: Immigration and Customs Enforcement, Pew, Center for Migration Studies, Author’s Estimates, Author’s Calculations.
President Obama’s administration removed an average of 1.38 percent of the interior illegal immigrant population each year of his presidency. The Obama administration’s interior removal statistics show a downward trend beginning in 2011 and continuing until through the end of the fiscal year 2016.
The Obama administration also focused immigration enforcement on criminal offenders (not all illegal immigrants are criminals). During the Obama administration, 53.3 percent of all illegal immigrants removed were criminals, including those who violated immigration crimes. The Trump administration has continued to focus on removing criminals in 2017. However, criminal removals during the first year of Trump’s administration are slightly below those of 2016 (Figure 3).
Figure 3
Criminal Removals as a Percent of All Removals
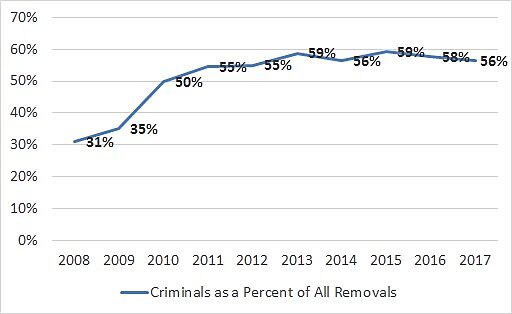
Source: Immigration and Customs Enforcement.
The Trump administration has just begun to ramp up interior immigration enforcement. The 2017 figures show a reversal of the declining interior immigration enforcement efforts under the Obama administration but they have not reached peak enforcement performance yet. The increased number of administrative arrests for immigration violations, the worsening immigration court backlog, and revival of Secure Communities all indicate that this administration will continue to increase interior immigration enforcement in subsequent years.
