The lies begin right in the headline of the American Public Transportation Association’s annual press release patting the industry on the back for carrying heavily subsidized riders last year. “Record 10.5 Billion Trips Taken On U.S. Public Transportation In 2012,” claims the press release headline.
The text reveals that it wasn’t actually a record at all, but merely the “second-highest ridership since 1957.” When was the first highest? In 2008, meaning the headline would have been more accurate if it had read, “Transit Ridership Falls Since 2008.”
Of course, as a lobby group, APTA is paid to promote the transit industry. Reporters are also paid to see through lobbyists’ lies, but unfortunately many of them simply modestly rewrite the press release while others add their own questionable analyses.
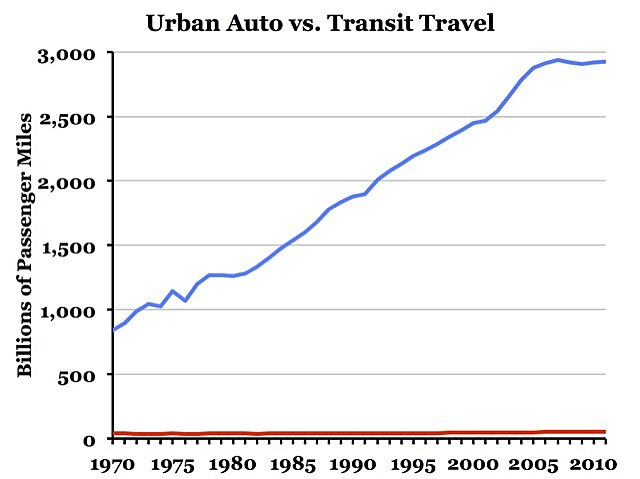
Source: Auto driving is from the Federal Highway Administration’s Highway Statistics series, while the transit numbers are from APTA’s own Public Transportation Fact Book.
Anti-auto writers gleefully report that transit ridership is growing faster than driving. While it is true that urban driving has stagnated since the 2008 financial crisis, the chart above shows that transit has a long way to go to catch up with driving. (Note that DC Streets Blog reports on total driving, while I use urban driving, which is a better comparison with urban transit.)
In 2012, transit carried about 1.8 percent of motorized urban passenger miles, which is about what transit’s share of urban passenger miles has been, plus or minus 0.1 percent, since 1993. Before then, it was 2.1 percent in 1990, 3.1 percent in 1980, and 4.7 percent in 1970. The roughly half a trillion dollars spent subsidizing transit since 1970 hasn’t done much good.
Another point APTA carefully neglects to mention is that urban population growth is the main source of transit ridership growth. Transit carried about 44 trips per urban resident in 2012, which is about what it has been, plus or minus 1 trip, since 2005. Prior to that, they grew since 1995, when they were just 38, but steadily shrank before then. In 1990, there were 47 trips per capita and in 1980 there were 51.
The press release also reports that the fastest growing form of transit is light rail. But it neglects to mention that that is mainly because of new construction. In fact, the miles of rail are growing far faster than rail riders.
In 1994, light rail carried more than 500,000 trips per route mile. By 1999 this had fallen below 400,000 trips per mile; by 2012 it was down to 300,000 trips per mile. With rising construction costs and falling ridership per mile, light rail is suffering from some seriously diminishing returns.
It is certainly reasonable to ask whether the stagnation of urban driving is a trend or simply a reflection of the recession and high unemployment rates among young people. But it is not reasonable to think that transit is providing an adequate substitute for urban driving.
According to the Federal Highway Administration’s traffic volume trends, urban driving declined by 11 billion vehicle miles between 2007 and 2012. Considering average occupancy rates, that’s roughly 16 billion passenger miles. In that time period, urban transit gained about 3 billion passenger miles, all of them between 2007 and 2008. To the extent that people really are driving less, it is more because they are traveling less than that they are riding transit more.
