A new report from the American Public Transportation Association (APTA) comes out firmly in support of the belief that correlation proves causation. The report observes that traffic fatality rates are lower in urban areas with high rates of transit ridership, and claims that this proves “that modest increases in public transit mode share can provide disproportionally larger traffic safety benefits.”
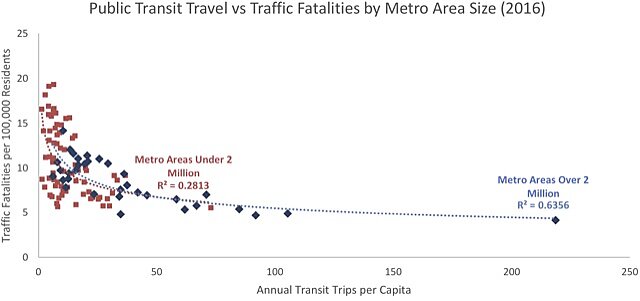
Here is one of the charts that APTA claims proves that modest increases in transit ridership will reduce traffic fatalities. Note that, in urban areas with fewer than 25 annual transit trips per capita — which is the vast majority of them — the relationship between transit and traffic fatalities is virtually nil. You can click the image for a larger view or go to APTA’s document from which this chart was taken.
In fact, APTA’s data show no such thing. New York has the nation’s highest per capita transit ridership and a low traffic fatality rate. But there are urban areas with very low ridership rates that had even lower fatality rates in 2012, while there are other urban areas with fairly high ridership rates that also had high fatality rates. APTA claims the correlation between transit and traffic fatalities is a high 0.71 (where 1.0 is a perfect correlation), but that’s only when you include New York and a few other large urban areas: among urban areas of 2 million people or less, APTA admits the correlation is a low 0.28.
The United States has two kinds of urban areas: New York and everything else. Including New York in any analysis of urban areas will always bias any statistical correlations in ways that have no application to other urban areas.
In most urban areas outside of New York, transit ridership is so low that it has no real impact on urban travel. Among major urban areas other than New York, APTA’s data show 2012 ridership ranging from 55 trips per person per year in Los Angeles to 105 in Washington DC to 133 in San Francisco-Oakland. From the 2012 National Transit Database, transit passenger miles per capita ranged from 287 in Los Angeles to 544 in Washington to 817 in San Francisco.
Since these urban areas typically see around 14,000 passenger miles of per capita travel on highways and streets per year, the 530-mile difference in transit usage between Los Angeles and San Francisco is pretty much irrelevant. Thus, even if there is a weak correlation between transit ridership and traffic fatalities, transit isn’t the cause of that correlation.
San Francisco and Washington actually saw slightly more per capita driving than Los Angeles in 2012, yet APTA says they had significantly lower fatality rates (3.7 fatalities per 100,000 residents in San Francisco and 3.6 in Washington vs. 6.4 in Los Angeles). Clearly, some other factor must be influencing both transit ridership and traffic fatalities.
With transit ridership declining almost everywhere, this is just a desperate attempt by APTA to make transit appear more relevant than it really is. In reality, contrary to APTA’s unsupported conclusion, modest rates in transit ridership will have zero measurable effect on traffic fatality rates.
