This morning, as anticipated, the Trump administration broadened the scope of its punitive tariffs on imports from China. The list of products subject to 25 percent duties increased from 818 to 1,097 harmonized tariff schedule (HTS) subheadings. Last year, the value of these imports from China amounted to roughly $50 billion, so the tax incidence (ceteris paribus), for the sake of the argument, will be roughly $12.5 billion.
As expected, Beijing retaliated in kind, assessing similar duties on a commensurate value of U.S. exports, which is certain to cause revenues to fall for U.S. producers of the industrial goods and agricultural products subject to those retaliatory tariffs. But let’s not forget the adverse impact of our own tariffs on our own manufacturers, farmers, construction firms, transportation providers, miners, wholesalers, retailers, and just about every other sector of the U.S. economy.
About half the value of U.S. imports consists of intermediate goods (raw materials, industrial inputs, machine parts, etc.) and capital equipment. These are the purchases of U.S. businesses, not households. The vast majority of the Chinese products on the tariff list fit this description. They are nearly all inputs to U.S. production. By hitting these products with tariffs at the border, the Trump administration is, in essence, imposing a tax on U.S. producers. Trump is raising the costs of production in the United States in sector after sector.
How significant is a roughly $12.5 billion tax in a $19 trillion economy? Well, not especially significant when put in that context. But that context masks the burdens directly imposed on the companies that rely on these inputs and indirectly imposed on their workers, vendors, suppliers, and downstream customers.
The Input-Output tables produced by the U.S. Bureau of Economic Analysis reveal—among other things—information about the relationships between industries in the United States. The “Use” tables map the output of all industries to their uses by other industries as inputs, as well as by end users.
The most recent “detailed” tables present the U.S. economy in 2007. The value of total commodity output at the time was $26.2 trillion, of which $14.5 trillion was consumed for end use and $11.7 trillion was consumed as intermediate inputs to further production. The $11.7 trillion dollar value of output from each of 389 industries (defined at the 6‑digit NAICS level) is mapped to the input of each of the other 388 industries. In other words, $11.7 trillion of commodity output from 389 industries is simultaneously depicted as $11.7 trillion of intermediate inputs to 389 industries. Although the values of that industry-specific output and input certainly have changed over 10 years, it is not unreasonable to assume a roughly similar composition of input use on a percentage basis. (Sure, production processes change and, consequently, the inputs demanded change too. But the 2007 table provides the best information available and it should produce some useful results.)
Trump’s tariffs apply to 1,097 products as defined by the Harmonized Tariff Schedule’s 8‑digit subheadings. Those 1,097 HTS numbers map to 102 (of 389) 6‑digit NAICS codes on the BEA’s Input-Output table. By aggregating the value of those 102 “tariffed” NAICS codes and taking that sum as a percentage of the total intermediate goods consumed, we can get a rough estimate of the burden of the tariffs on each of the 389 industries. (Note: In most cases, the estimate is likely to be higher because many NAICS‑6 codes include more HTS‑8 codes than are subject to the tariffs.)
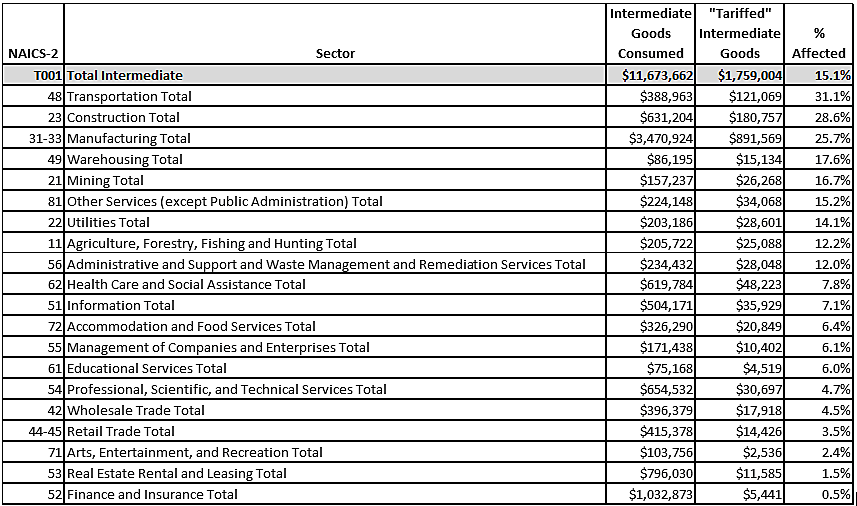
Table 1 ($ millions)
As the first line in Table 1 shows, the total value of intermediate goods consumed (in 2007) was $11.7 trillion; the 2007 value of the 102 NAICS codes that include HTS numbers hit with Trump’s tariffs was $1.8 trillion; and the percentage of intermediate goods affected is 15.1%. That’s the average.
The subsequent lines in the table are presented in descending order of impact by sector (2‑digit NAICS). So, the transportation sector consumed $389 billion of intermediate goods in 2007 and $121 billion (or 31.1%) of that consumption is now subject to tariffs. The manufacturing sector consumed $3.5 trillion (almost 30% of the total) of intermediate goods in 2007 and $892 billion (or 25.7%) is now subject to tariffs.
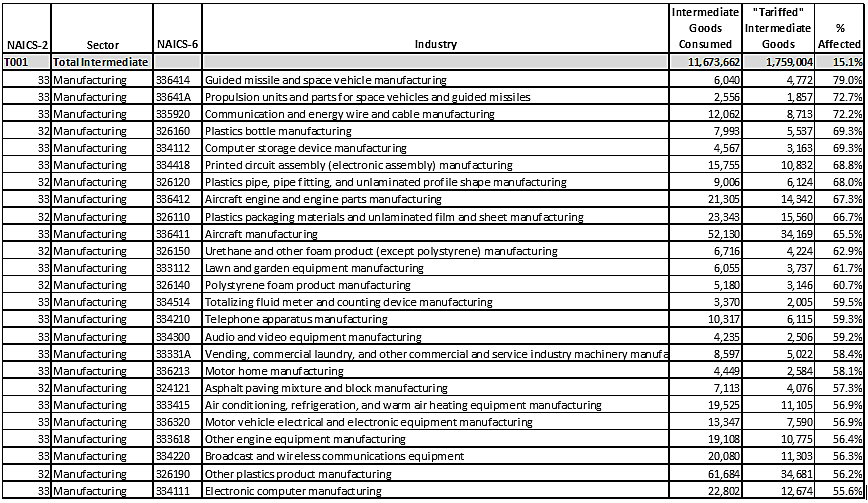
Among those likely to be most burdened by Trump’s tariffs are industries within the manufacturing sector. In fact, every industry with more than 50 percent of their intermediate inputs subject to the tariffs is in the manufacturing sector. Table 2 shows the 25 most exposed industries (at the NAICS‑6 level)—those with the greatest percentage of intermediate inputs subject to the tariffs.
Table 2($ millions)
Although this analysis doesn’t attempt to get at the actual cost increases that many industries will have to endure, it reinforces and makes clear the fact that tariffs are always about politicians bestowing favors on the few at the expense of many other industries.


