The amount of future warming is predicated on the amount of emitted greenhouse gases and the sensitivity of earth’s surface temperature to changes in their concentrations. Here we take a look at the emissions component.
The U.N. currently entertains four emissions scenarios, all expressed as the change in downwelling radiation (in watts/meter-sq, nominal year 2100) towards the surface that results from an increase in the atmospheric concentration of certain greenhouse gases. They are called “representative concentration pathways,” or RCPs.
As can be seen in Figure 1, there are four, given as 2.6, 4.5, 6(.0) and 8.5. The ranges of associated warming for over 1000 total scenarios are given on the right axis.
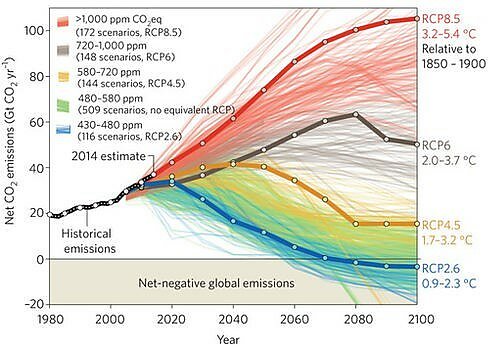
Figure 1. Approximately 1000 scenario runs for four RCPs. From Fuss et al., 2014.
It’s not surprising that those making the case for climate action most frequently reference the highest (RCP8.5), embedding it in most climate scenarios, assessments, and international agreements (the Paris Agreement being a prime example). Here is a summary of Google Scholar citations for the different RCPs, published on February 9 by Eric Roston in Bloomberg:
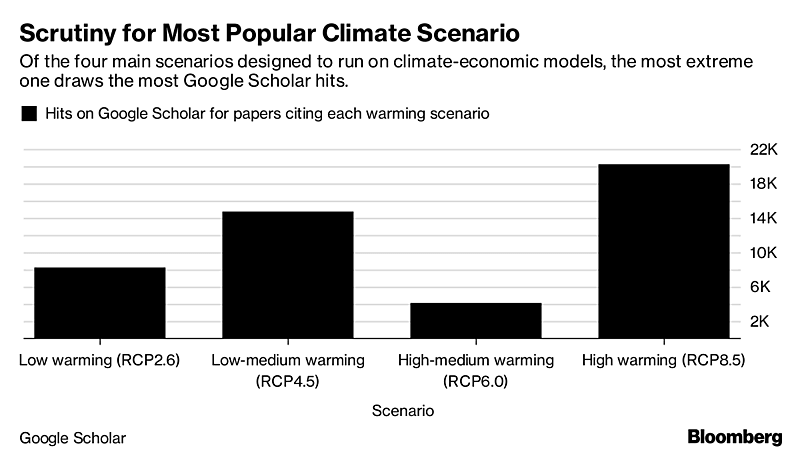
Figure 2. Although increasingly untenable, RCP8.5 draws the most attention.
RCP8.5 is obsolete. It was obsolete when it was first published in the journal Climate Change by Riahi et al. in 2011. By then the shale gas revolution was underway, as can be seen from the plot below of shale gas production. By 2011, abundant shale gas had begun a wholesale displacement of coal for electrical generation, increasing natural gas’s portion of our energy portfolio and decreasing that of coal.
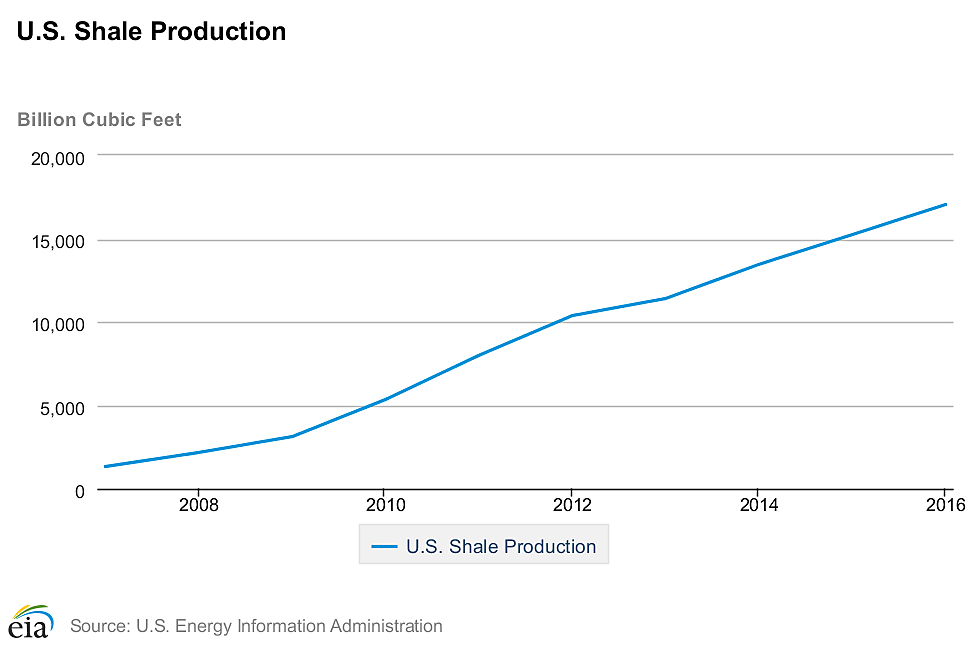
Figure 3. U.S. shale gas production, 2007–2016, according to the U.S. Energy Information Administration.
The Riahi et al. RCP 8.5 continues to be the favorite for analysts. It completely dominates the draft of the upcoming fourth “National Assessment” of climate change, created by our U.S. Global Change Research Program. Here is the fanciful “wedge chart” for various energy sources in RCP8.5:
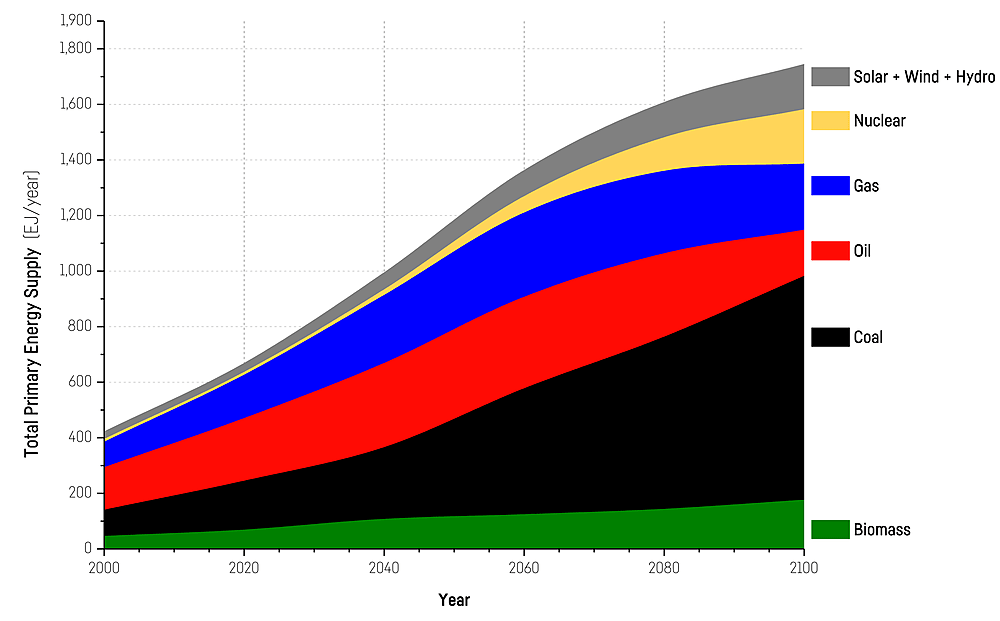
Figure 4. Energy contributions (in Joules X 1018, or EJoules) in RCP 8.5.
There are at least two notable errors in RCP8.5, which both serve to exaggerate its radiative forcing. The first is an incorrectly modest growth in natural gas use, and the second is the massive growth in coal combustion. According to the International Energy Agency (2017):
The global natural gas market is undergoing a major transformation driven by new supplies coming from the United States to meet growing demand in developing countries and industry surpasses the power sector as the largest source of gas demand growth…[emphasis added]
The evolution of the role of natural gas in the global energy mix has far-reaching consequences on energy trade, air quality and carbon emissions…
Global gas demand is expected to grow by 1.6% a year…China will account for 40% of this growth.
British Petroleum (BP) recently estimated the global fuel mix through 2040 in its 2018 Energy Outlook. Under their “Evolving Transition” assumption, natural gas usage passes coal worldwide around 2030, and oil use levels off at the same time. A comparison to RCP 8.5 (above) shows how wrong it is, even in the near future.
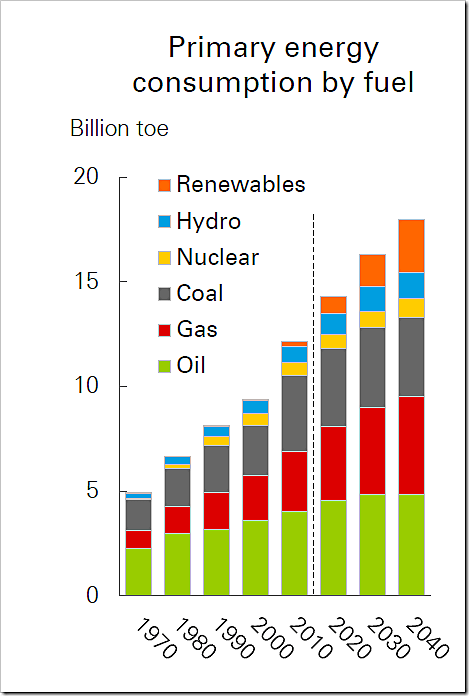
Figure 5. British Petroleum’s fuel outlook from its most recent (2018) Energy Outlook. Note the color scheme is somewhat different than in Figure 4, with natural gas now red, instead of blue.
The substitution of shale gas for coal continues to drive down the “carbon (dioxide) intensity” of developing and developed economies. This is the amount of carbon (dioxide) emitted per unit of GDP, usually normalized to 2010 dollars adjusted for their purchasing power in a given economy. In the United States, in the quarter-century beginning in 1990, the drop was a remarkable: from 0.9kg of carbon dioxide/dollar to 0.35, or over 60%.
The imminent dethroning of King Coal is obvious in the BP data, which leads to another problem: Justin Ritchie and Hadi Dowlatabadi from University of British Columbia recently found there simply isn’t enough coal to support RCP8.5. Nor were they conservatively looking at so-called “recoverable” reserves; instead, they toted up all geologically identified coal around the planet.
They then adjusted RCP8.5 for the twin errors of increasing carbon (dioxide) intensity by a huge growth in coal use over natural gas (recall that IEA indicates large scale industrial as well as electrical switchover), and the fact that there isn’t enough coal, and modified RCP8.5 to look like this:
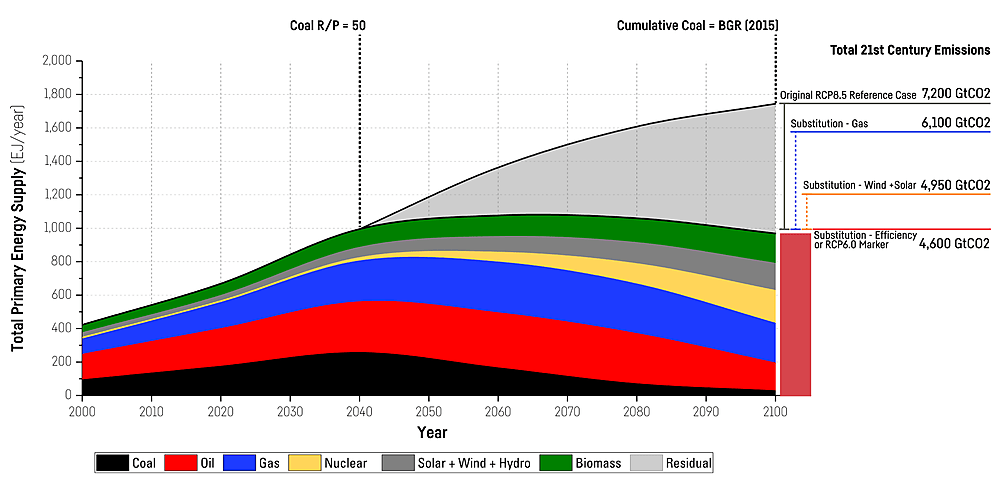
By comparing the contribution of oil, coal, and natural gas (the greenhouse gas sources) between RCP8.5 and what is likely to happen, we can estimate the total downwelling radiation change: it drops from 8.5 watts to roughly 5.1. (Recognizing there is a lot of fine print—this is certainly a ball-park number.)
It is the nature of climate models to scale global warming with percentage changes in emissions; i.e. a quadrupling of emissions has almost exactly the effect of doubling prospective warming over that forecast from an initial doubling of the concentration. Reducing emissions by 40%, which is the difference between Rihai’s RCP8.5 and Ritchie’s modification, similarly reduces total warming.
There’s the further problem of model overprediction of warming that we recently documented in our public comments on the upcoming Fourth National Assessment of Climate Change. Generally speaking, we find the data-based sensitivity of temperature to be about 56% of the average of the 105 climate models in the UN’s most (2013) science summary.
Multiplying everything through, we take the mean 20th and 21st century RCP8.5 warming of 4.3⁰C, adjust by 60% to get the difference with the modified RCP, and then adjust for the 56% sensitivity and we find a 21st century warming a teense under 1.5⁰C—very, very close to the sensitivity just calculated by University of Alabama-Huntsville’s Roy Spencer.
REFERENCES
British Petroleum 2018 Energy Outlook at https://www.bp.com/content/dam/bp/en/corporate/pdf/energy-economics/energy-outlook/bp-energy-outlook-2018.pdf
Fuss, S., et al, 2014. Betting on Negative Emissions. Nature Climate Change 4, 850–853
IEA, 2017. IEA Sees Global Gas Demand Rising to 2022 as US Drives Market Transformation. https://www.iea.org/newsroom/news/2017/july/iea-sees-global-gas-demand-rising-to-2022-as-us-drives-markettransformation.html
Riahi, K., Rao, S., Krey, V. et al. Climatic Change (2011) 109: 33. https://doi.org/10.1007/s10584-011‑0149‑y
Ritchie J and Dowlatabadi H 2017. The 1000 GtC coal question: are cases of vastly expanded future coal combustion still plausible? Energy Econ. 65 16–31.
Roston, E., 2017, at: https://www.bloomberg.com/news/articles/2017–05-24/misleading-coal-estimates-may-have-skewed-climate-projections
Ryan Maue of Cato’s Center for the Study of Science provided important background material for this post.
