At a recent Senate hearing, Senator Elizabeth Warren worried that we would “let rich people keep paying taxes at about half the rate as everyone else.” (At 2:03). Senator Warren, President Biden, and other political leaders often say that people at the top are not paying their “fair share” of taxes.
I heard many similar complaints Wednesday at a Ways and Means subcommittee hearing. I testified about problems with the president’s tax plan, but the other panelists and numerous committee members focused on how federal taxation supposedly favors the rich and high earners.
As a general matter, the narrative that the well-off have a lighter tax burden than the rest of us is nonsense. There are certainly unjustified tax breaks that benefit high earners, such as the income tax exemption on municipal bonds. But data on overall tax rates show clearly that households at the top pay far higher tax rates, on average, than households in the middle or at the bottom. Let’s look at three authoritative data sources.
Internal Revenue Service (IRS)
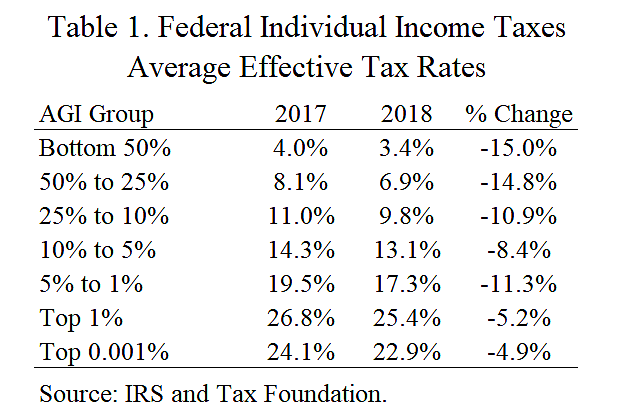
Table 1 shows IRS data for average effective income tax rates in 2017 and 2018. That is, total income taxes paid divided by income for each percentile group. Income is AGI. The data is from here and here.
- The tax rates on the highest-income groups are far higher than on the lower-income groups.
- The data do not include the refundable portions of low-income tax credits, so it overstates the net taxes on the bottom 50 percent group.
- The 2017 Tax Cuts and Jobs Act (TCJA) cut income taxes for 2018. The table shows that the top-end tax cuts of about 5 percent were smaller in percentage terms than cuts for the middle and bottom groups.
- A complaint expressed at the Wednesday hearing was that top earners make out like bandits because they receive substantial capital gains, which faces lower tax rates than ordinary income. The top 0.001 percent group does report a lot of capital gains, which pushes the group’s tax rate lower than the 1 percent group. However, the tax rate on the 0.001 percent group is still far higher than the rates on the middle and lower groups.
Tax Policy Center (TPC)
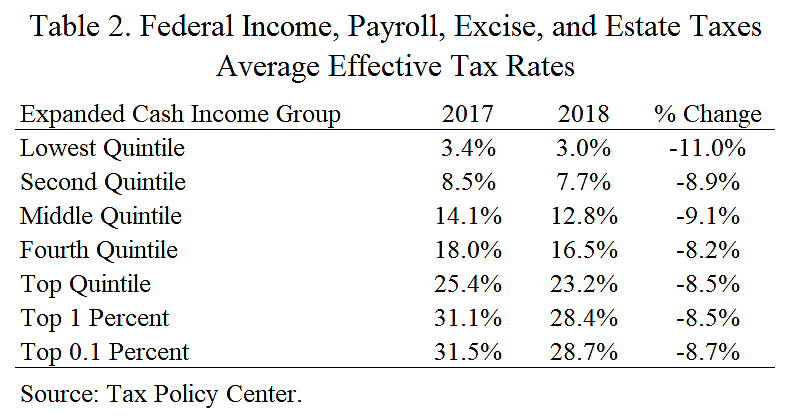
Table 2 shows average effective tax rate data from TPC along with my calculations of percent change. (Data from T20-0033 and T20-0035). These are total federal taxes, including individual income, corporate income, payroll, estates, and excises. TPC’s measure of income is broader than the IRS measure. The table shows data for 2017 and 2018, before and after the TCJA.
- Tax rates in 2018 ranged from 3.0 percent at the bottom to 28.7 percent at the top. The highest earners have an average tax rate twice the rate of those in the middle and almost ten times the rate of those at the bottom. Senator Warren’s comment about the rich paying “half the rate” is ridiculous.
- The TCJA cut overall federal taxes a similar percentage across the board. Note that a percentage cut in the average effective tax rate is the same as the percentage cut in actual tax dollars paid.
Joint Committee on Taxation (JCT)
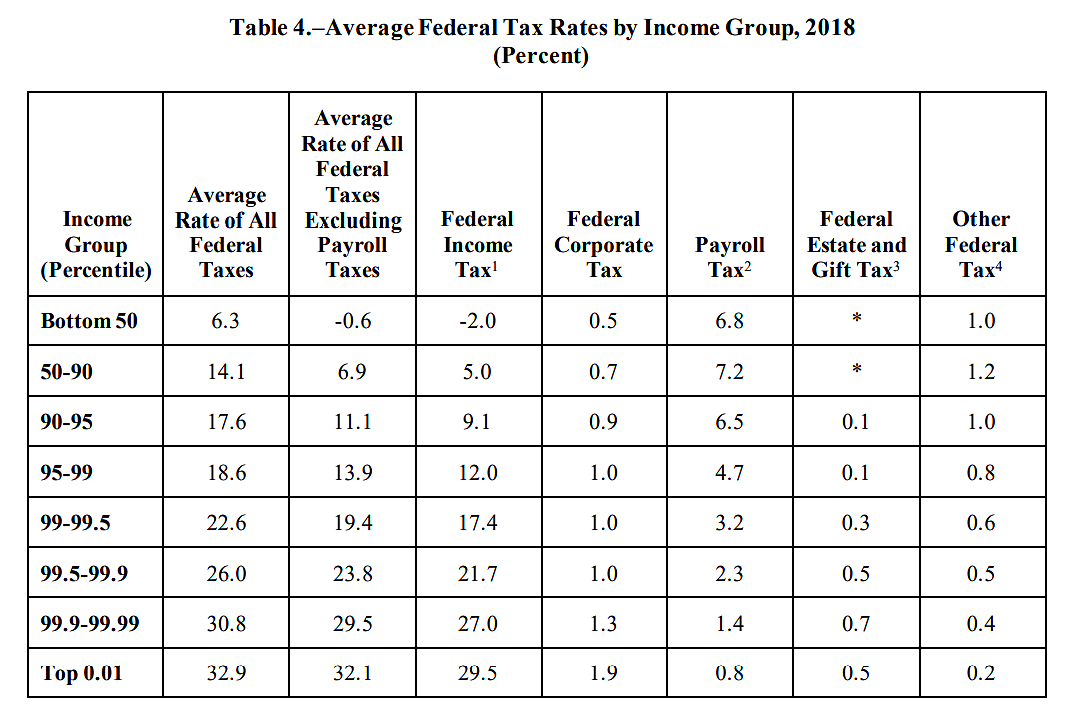
The JCT released a report Monday with various tax distribution estimates. The report’s Table 4 below shows average effective tax rates for all federal taxes, including individual income, corporate income, payroll, estate, and other. Like TPC, the JCT uses a broad income measure.
- The average tax rate ranges from 6.3 percent on the bottom half to 32.9 percent on the top 0.01 percent. The rate on the top group is more than double the rate on the upper-middle income group (50–90 percentile).
- Despite complaints that individuals at the top receive a lot of capital gains at low tax rates, the overall tax rate on the top 0.01 percent group is higher than all the other groups.
- Just looking at individual income taxes, the average rate goes from ‑2.0 percent to 29.5 percent. That bottom half, on net, do not pay any federal income taxes. Rather, they receive subsidies (refundable credits) from the U.S. Treasury.
- While the bottom 50 and 50–90 percent groups paid the highest payroll tax rates, the large income tax payments by the top groups produced overall rates much higher at the top end.
One of the panelists at the hearing complained that over the last several decades, “changes in tax policy have also tended to favor the highest-income taxpayers.” The chart here from the Congressional Budget Office clearly shows that statement is not correct. For all federal taxes, the average tax rate for the top 1 percent has hovered around 30 percent, while the rates on the bottom quintile and three middle quintiles have fallen.
The same panelist further claimed that over the past several decades, “reduced rates on high-income taxpayers have not only made the tax system less progressive but also impaired other fiscal goals.” This claim about “less progressive” is also not correct. The JCT report noted, “Since 1985, the progressivity of the Federal tax system has increased every decade.”