The Media Research Center published my observations about a recent New York Times article regarding tax rates on high earners. The Times article presented data purporting to show “just how far taxes on the wealthy have fallen over the past 70 years.” And the piece claimed, “For most of the past quarter-century, taxes on the affluent have continued falling, including the rates on corporate profits, personal income, stock dividends, stock holdings and inheritances.”
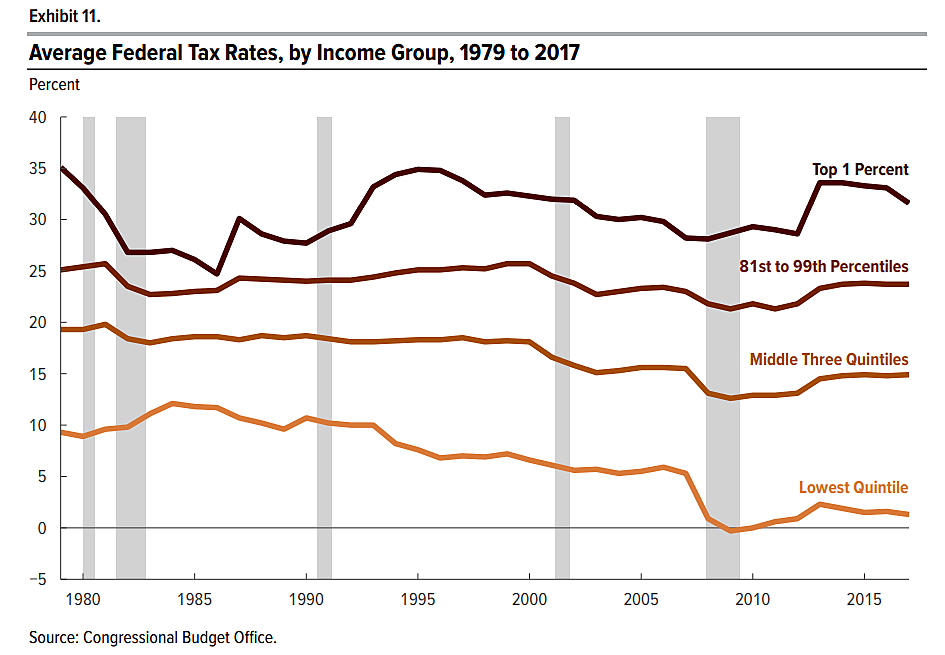
I pointed out to MRC reporter Joseph Vazquez that is not what authoritative data from the Congressional Budget Office show. The chart below is from the most recent CBO analysis of household income and taxes (page 18). The tax rates in the chart include federal individual income, corporate income, payroll, and excise taxes. They are average effective tax rates, meaning total tax payments divided by the CBO measure of income.
You can see that the average tax rate for the top 1 percent of earners is roughly as high as during the 1980s, although with some ups and downs along the way. The big change is that the average tax rate on the bottom fifth of households has plunged to near zero. The average tax rate on the middle three-fifths of households has also fallen.