Global Science Report is a feature from the Center for the Study of Science, where we highlight one or two important new items in the scientific literature or the popular media. For broader and more technical perspectives, consult our monthly “Current Wisdom.”
—
There is a new paper generating some press attention (e.g. Chris Mooney at the Washington Post) that strongly suggests global warming is leading to specific changes in the atmospheric circulation over the Northern Hemisphere that is causing an enhancement of surface melting across Greenland—and of course, that this mechanism will make things even worse than expected into the future.
We are here to strongly suggest this is not the case.
The new paper is by a team of authors led by Marco Tedesco from Columbia University’s Lamont-Doherty Earth Observatory. The main gist of the paper is that Arctic sea ice loss as a result of human-caused global warming is causing the jet stream to slow down and become wigglier—with deeper north-south excursions that hang around longer. This type of behavior is referred to as atmospheric “blocking.”
If this sounds familiar, it’s the same theoretical argument that is made to try to link wintertime “polar vortex” events (i.e., cold outbreaks) and blizzards to global warming. This argument which has been pretty well debunked, time and time again.
Well, at least it has as it concerns wintertime climate.
The twist of the new Tedesco and colleagues’ paper is that they’ve applied it to the summertime climate over Greenland. They argue that global warming is leading to an increase in blocking events over Greenland in the summer and that is causing warm air to be “locked” in place leading to enhanced surface melting there. Chris Mooney, who likes to promote climate alarm buzzwords, refers to this behavior as “weird.” And he describes the worrysome implications:
The key issue, then, is whether 2015 is a harbinger of a future in which the jet stream keeps sending Greenland atmospheric systems that drive major melt — and in turn, whether the Arctic amplification of climate change is driving this. If so, that could be a factor, not currently included in many climate change simulations, that would worsen the ice sheet’s melt, drive additional sea level rise and perhaps upend ocean currents due to large influxes of fresh water.
As proof that things were weird over Greenland in recent summers, Tedesco’s team offers up this figure in their paper:
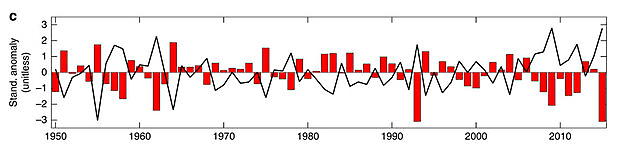
This chart (part of a multipanel figure) shows the time history of the North Atlantic Oscillation (NAO—a pattern of atmospheric variation over the North Atlantic) as red bars and something called the Greenland Blocking Index (GBI) as the black line, for the month of July during the period 1950–2015. The chart is meant to show that in recent years, the NAO has been very low with 2015 being “a new record low of ‑1.23 (since 1899),” and the GBI has been very high with the authors noting that “[c]oncurrently, the GBI also set a new record for the month of July [2015].” Clearly the evidence is showing that atmospheric blocking increasing over Greenland which fits nicely into the global warming/sea ice loss/wiggly jet stream theory.
So what’s our beef?
A couple of months ago, some of the same authors of the Tedesco paper (notably Ed Hanna) published a paper showing the history of the monthly GBI going back to 1851 (as opposed to 1950 as depicted in the Tedesco paper).
Here’s their GBI plotted for the month of July from 1851 to 2015:
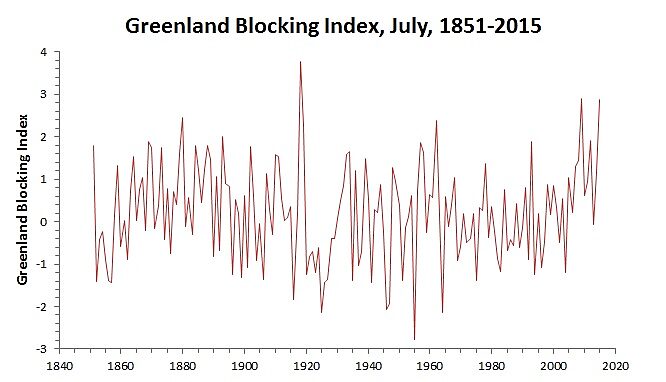
This picture tells a completely different story. Instead of a long-term trend that could be related to anthropogenic global warming, what we see is large annual and multidecadal variability, with the end of the record not looking much different than say a period around 1880 and with the highest GBI occurring in 1918 (with 1919 coming in 2nd place). While this doesn’t conclusively demonstrate that the current rise in GBI is not related to jet stream changes induced by sea ice loss, it most certainly does demonstrate that global-warming induced sea ice loss is not a requirement for blocking events to occur over Greenland and that recent events are not at all “weird.” An equally plausible, if not much more plausible, expectation of future behavior is that this GBI highstand is part of multidecadal natural variability and will soon relax back towards normal values. But such an explanation isn’t Post-worthy.
Another big problem with all the new hype is that history shows the current goings-on in Greenland to be irrelevant, because humans just can’t make it warm enough up there to melt all that much ice. For example, in 2013, Dorthe Dahl-Jensen and her colleagues published a paper in Nature detailing the history of the ice in Northwest Greenland during the beginning of the last interglacial, which included a 6,000 year period in which her ice core data showed averaged a whopping 6⁰C warmer in summer than the 20th century average. Greenland only lost around 30% of its ice with a heat load of (6 X 6000) 36,000 degree-summers. The best humans could ever hope to do with greenhouse gases is—very liberally—about 5 degrees for 500 summers, or (5 X 500) 2,500 degree-summers. In other words, the best we can do is 500/6000 times 30%, or a 2.5% of the ice, resulting in a grand total of seven inches of sea level rise over 500 years. That’s pretty much the death of the Greenland disaster story, despite every lame press release and hyped “news” article on it.
While you won’t find this kind of analysis elsewhere, we’re happy to do it here at Cato.
References:
Dahl-Jensen, D., et al., 2013. Eemian interglacial reconstructed from a Greenland folded ice core. Nature 489, doi: 10.1038/nature11789.
Hanna, E., et al., 2016. Greenland Blocking Index 1851–2015: a regional climate change signal. International Journal of Climatology, doi: 10.1002/joc.4673.
Tedesco, M., et al., 2016. Arctic cut-off high drives the poleward shift of a new Greenland melting record. Nature Communications, DOI: 10.1038/ncomms11723, http://www.nature.com/ncomms/2016/160609/ncomms11723/full/ncomms11723.html
