The results from Education Next’s annual poll are out, giving us a great opportunity to learn where people stand on a number of education-related issues. Many of the survey questions have been asked since the poll was started in 2007, so there are interesting trends to study. Others have been added in recent years to reflect concerns around COVID policies and cultural issues.
There are too many questions to cover them all here—you can click through their interactive charts to get the full picture. But I’ll delve into some highlights to help whet your appetite.
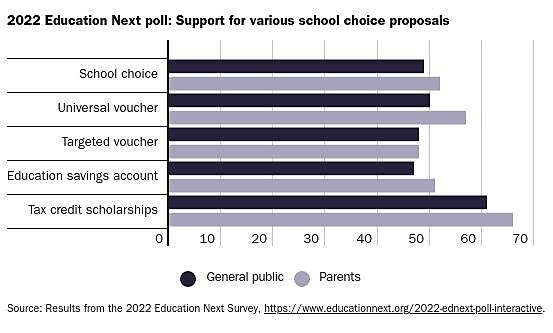
School Choice
I always look at the school choice responses first. On the generic “Do you support or oppose school choice?” question, 49 percent of the general public and 52 percent of parents expressed support. Just under 30 percent of each said they oppose school choice.
There was similar support for universal vouchers among the general public, but opposition was higher at 40 percent. Parental support was also higher, coming in at 57 percent with 34 percent opposed. Nearly every demographic preferred universal over targeted vouchers. Support for education savings accounts was similar or a bit lower among each group.
Tax credits for scholarship contributions drew the highest support numbers, at 61 percent for the general public and 66 percent for parents. I was surprised to see higher support among Democrats (64 percent) than Republicans (59 percent). Looking back at the trends shows fluctuations over the years in terms of which party shows higher support for tax credits.
Masking in schools
One of the Covid-era questions in this year’s poll is “Do you support or oppose requiring students in your local schools to wear face masks while in school?” This is one of many questions pointing to the need for more school choice options. Parents, who are the key demographic for this question, are pretty evenly split on it: 39 percent support and 42 percent oppose. Equipping parents to choose different educational options would defuse masks as a flashpoint.
Evaluating schools
As is typically the case, respondents have a much lower opinion of “public schools in the nation as a whole” than of the public schools in their community. While 52 percent of the general public and 59 percent of parents give their local schools an “A” or “B” grade, the results fall to 22 and 25 percent, respectively, at the national level.
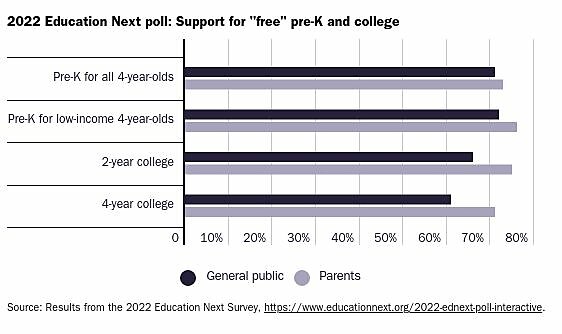
“Free” pre‑K and college
Some of the strongest support came under the questions about “free” pre‑K and college. But, of course, there’s no such thing as “free” pre‑K or college. Someone is paying. While the pre‑K questions include a mention of “government” paying for it, the college questions just ask about making it free to attend. Neither is really clear that it would be taxpayers—including those who didn’t attend college or who worked to pay their own way—footing the bill. It’s easy to support “free” when you don’t realize you may pay a hefty fee to achieve that.
Moreover, the support is tough to evaluate since it doesn’t include dollar amounts. It’s likely that support for spending $5,000 per child for pre‑K would be higher than for $15,000 per child. Similarly, people might be fine with spending $10,000 to send someone to college but balk at a $40,000 price tag.
The annual Education Next poll is an interesting read since they ask a wide variety of questions. You can see what people think about school spending, teacher salaries, unions, racial issues, and more. Results are reported by race and political party in addition to the general public and parents. This year, the accompanying write-up delves into the increasing partisanship around education issues with an in-depth analysis of the trends. Check out the full results—I’m sure something in it will surprise you.
