During the first few months of COVID-19 lockdowns, supporters of private schooling feared that the sector would take a huge enrollment, financial, and ultimately existential hit. During the summer, however, fears subsided. Cato’s tracker of COVID-related private school closings grew to almost 120 schools, but nowhere near mass extinction. And as public schools increasingly announced that they would only operate online to start the new year, anecdotal evidence suggested ramped-up private school demand. Meanwhile, national surveys offered mixed clues as to what might be happening to private schools.
To get a quick but more concrete sense of the start-of-the-year enrollment situation, Cato’s Center for Educational Freedom conducted a survey from September 9 to the 18th of 400 private schools with a highest grade of kindergarten or higher, randomly selected from the federal Private School Universe database. We asked only if a school’s enrollment had increased, decreased, or stayed the same from the previous school year, and by how many students it may have changed including and excluding pre‑K students.
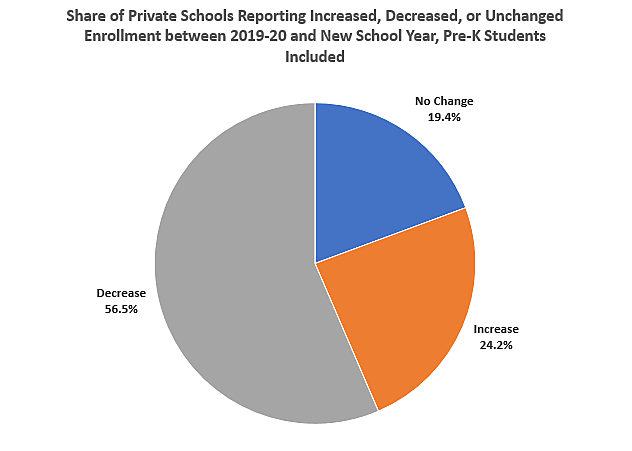
As shown below, we found that when pre‑K students are included, 57 percent of schools lost enrollment between last school year and the current one, 24 percent saw an increase, and 19 percent remained unchanged.
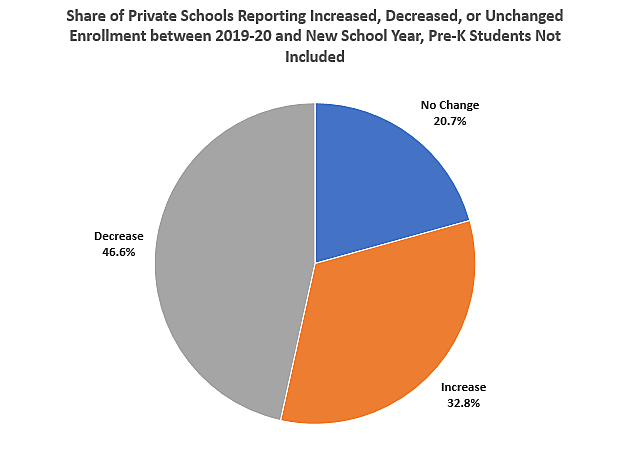
Excluding pre‑K students—so just looking at students in the K‑12 range—47 percent lost students, 33 percent increased, and 21 percent were unchanged.
What do enrollment numbers look like? Including pre‑K students, the average school lost slightly fewer than 14 students, and without pre‑K the average loss approached 6 students. To put those losses in context, the average school that responded to our survey enrolled about 225 students, including pre‑K, according to the most recent enrollment data we could find. So they experienced, on average, roughly a 6 percent enrollment loss. The range of changes was large, from a gain of 90 students to a loss of 137. Not including pre‑K students, the range was a gain of 75 to a loss of 100.
Note that one school that replied to our survey closed due to COVID-19. It is included in calculations of shares of schools with increasing, decreasing, or unchanged enrollments but not specific numbers. That school has been added to the closure tracker.
There are important limits to this survey. We conducted it quickly to begin filling a vacuum of information on how private schools were faring as the school year began. We only received 62 usable surveys—a 16 percent response rate—yielding a margin of error of +/- 12 percentage. We did not receive changes specifically for non-pre‑K students from 4 schools that had pre‑K students, so results excluding pre‑K students are for only 58 schools, yielding a margin of error of +/- 13 percent. Also, we gathered total previous enrollment data from several sources that might be older than the previous year—we asked schools only for net gain or loss figures—and a handful of losses would be larger than the possibly old total enrollment recorded. We kept numbers as reported. Finally, while the 400 schools contacted were randomly selected, it is not clear that responses were not skewed in some way. That said, one check—the share of schools that are Catholic—suggested responses were close to representative: 21 percent were Catholic, almost exactly matching the Catholic share of all private schools according to recent federal figures. Similarly, Baptist schools composed about 5 percent of our respondents and account for roughly 5 percent of all private schools.
Of course, better polling as the year goes on and deeper analysis are needed, but these findings help provide some broad, early insight into 2020–21 effects of COVID-19 on private schools.
