When COVID-19 struck the United States in March 2020, private schools appeared to be in very precarious positions. Largely reliant on voluntarily paying families, a combination of forced online – and hence degraded – instruction, and an economic downturn likely to hit families’ wallets hard, appeared to be an existential threat to many schools. As Cato’s COVID-19 private school closure tracker, and a quick survey we conducted at the start of the 2020–21 school year indicated, American private schooling did, indeed, suffer.
After the first few months, however, things started looking up. As the 2020–21 school year progressed, and private schools were much more likely to open for in-person instruction than public, news reports of families moving their children out of public and into private institutions started percolating up. We also saw schools, and larger organizations such as Roman Catholic dioceses, reporting influxes of students. There were, however, no national data available to confirm whether these were representative of a larger trend.
Like last year, Cato’s Center for Educational Freedom has conducted a survey to gauge trends in private school enrollment. We randomly selected a nationally representative sample of private schools and asked them if their enrollments had increased, decreased, or not changed between the end of the 2020–21 school year and the start of 2021–22, and by how many students. We also asked if they had seen their enrollments increase, decrease, or stay the same over the course of the 2020–21 school year, to assess if anecdotal reports of movements to private schools over the previous school year were part of a trend.
Enrollment Findings
Our results suggest that anecdotes of enrollment gains during the last school year were indicative of a larger trend, and that private schools gained students between the end of the 2020–21 academic year and the start of 2021–22.
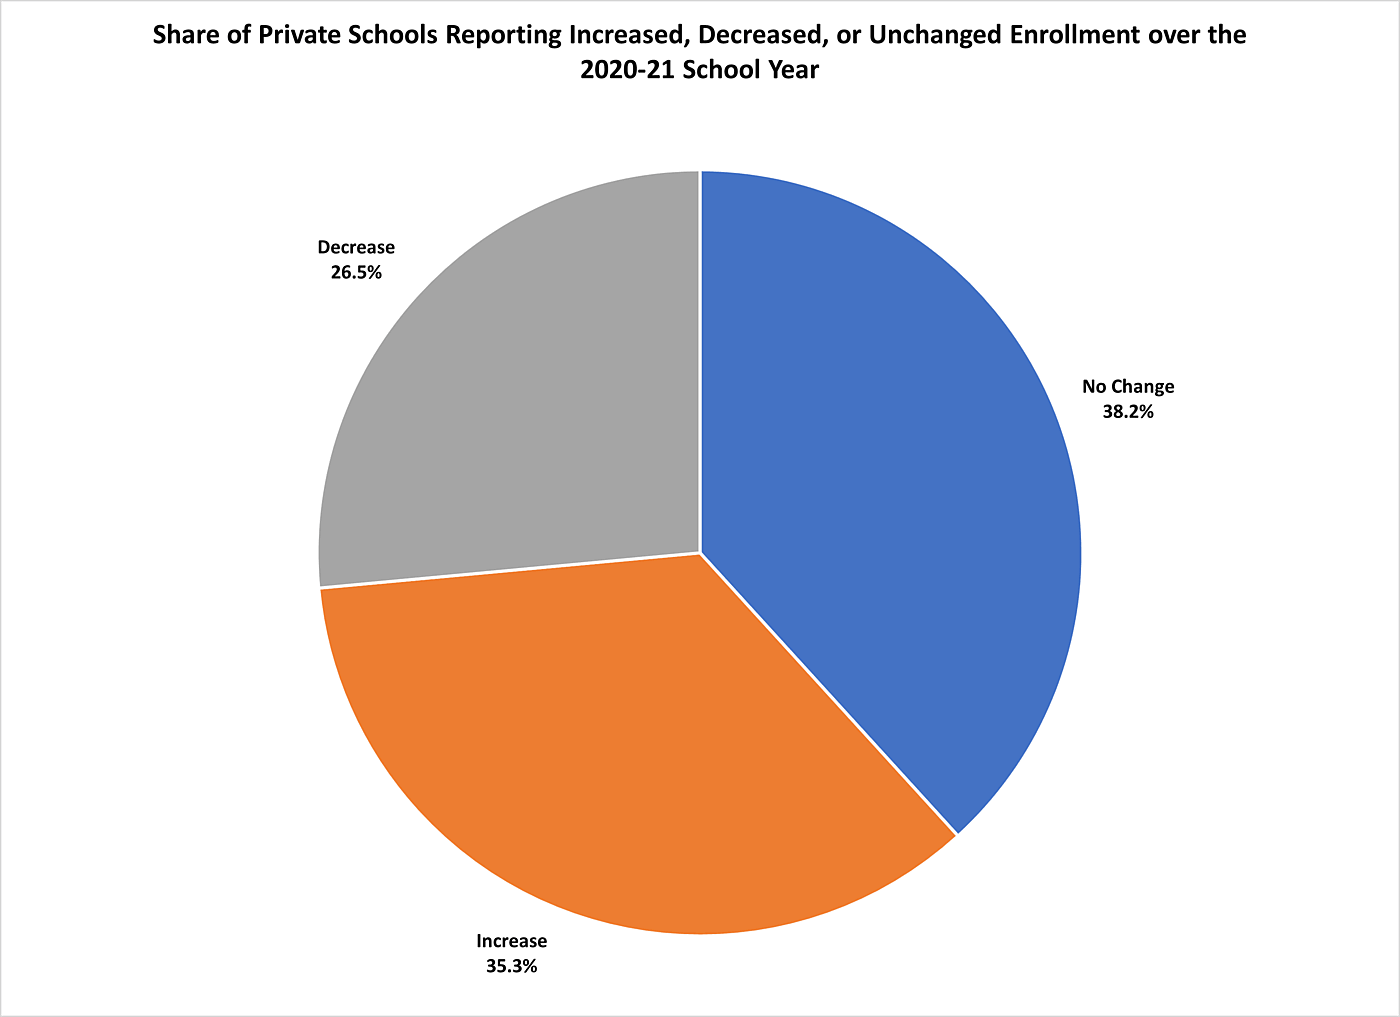
Looking at enrollment over the course of the 2020–21 school year, 35 percent of the 68 schools that provided data reported increases, 38 percent stood pat, and 27 percent recorded losses. That suggests that enrollment gainers outnumbered losers over the course of the year, though our survey has a high +/- 12 point margin of error. We did not ask schools for specific enrollment change numbers from the beginning to the end of the 2020–21 school year.
To assess schools’ enrollment changes between the previous school year and the new one – basically, change over the summer – we asked for changes both including pre‑K and excluding pre‑K students. Our primary interest is K‑12 enrollment, but the financial health of a school with pre‑K is, of course, impacted by pre‑K enrollment.
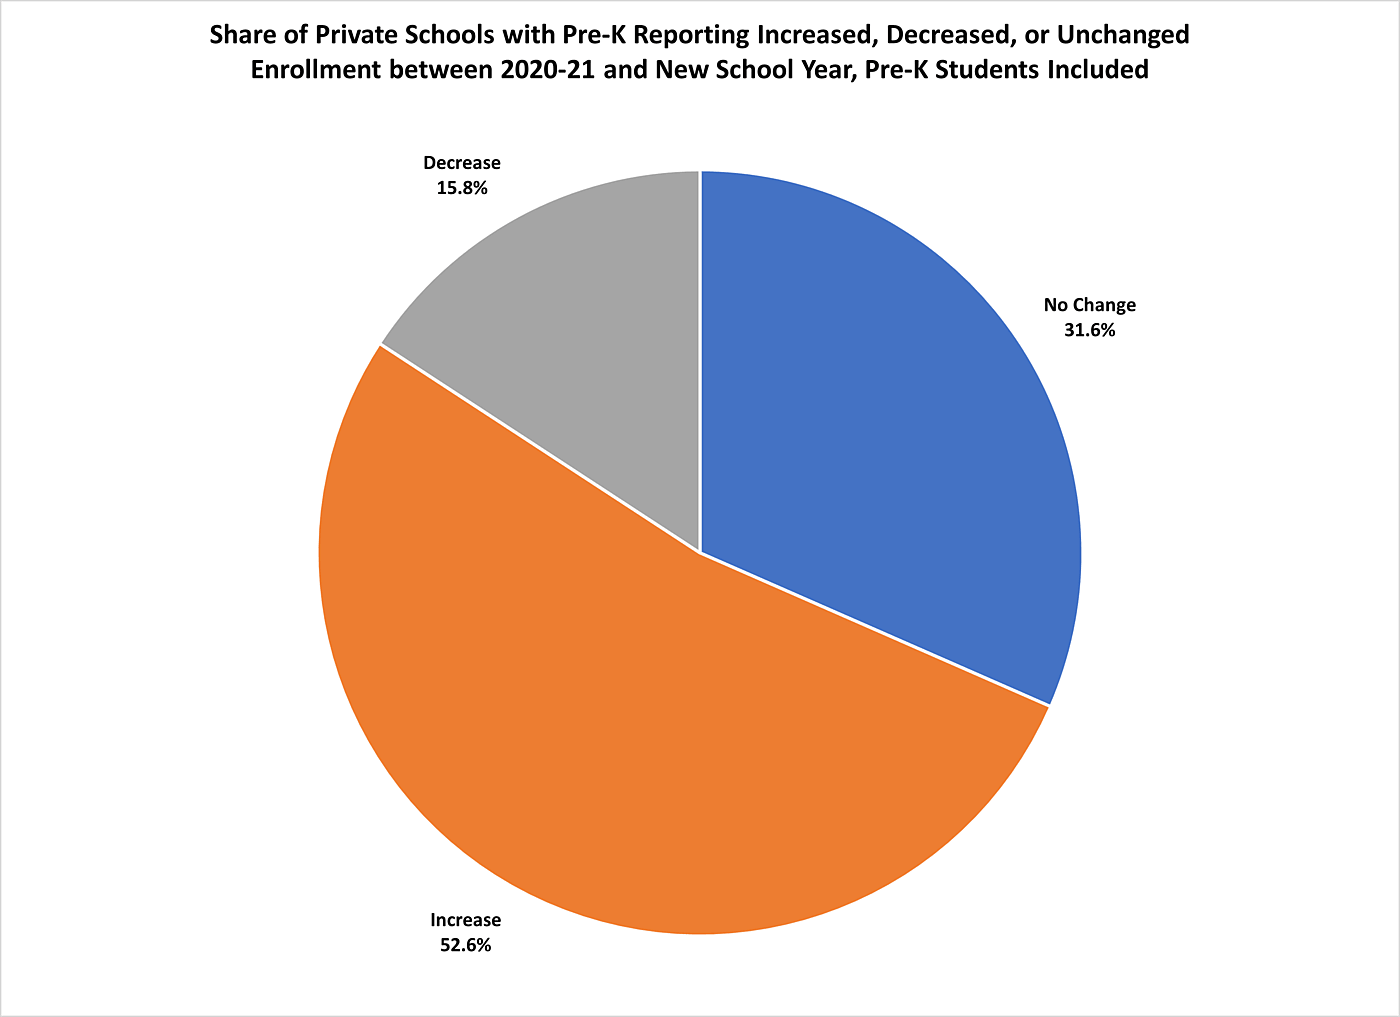
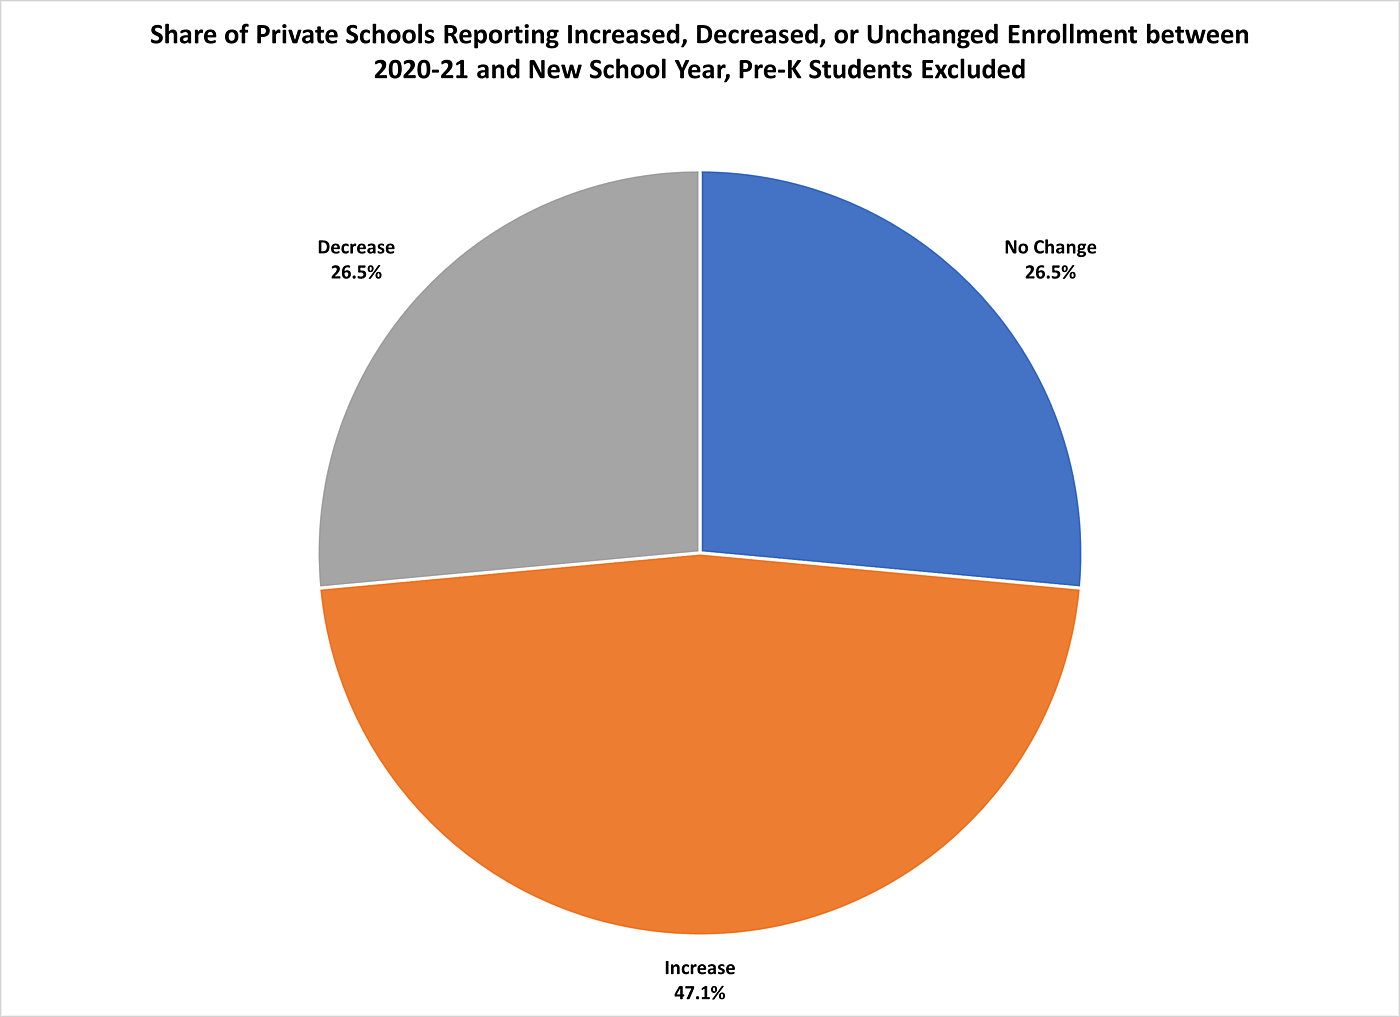
Looking at schools with pre‑K students (57 institutions) and their enrollments including pre‑K, 53 percent saw increases, 32 percent no change, and 16 percent decreases. Because the sample is smaller than the all-school sample, the margin of error is +/- 13 percentage points. For all schools – 68 institutions – and excluding pre‑K enrollments, 47 percent reported increases, 27 percent no change, and 27 percent losses.
In terms of the number of students gained, when examining schools with pre‑K and including pre‑K students, the mean school that provided data (54 schools) saw an increase of about 13 students between the end of 2020–21 and the start of 2021–22. The range was from a loss of 50 to a gain of 99.
For schools with and without pre‑K, and not including pre‑K for schools with it, the mean change was a gain of 7 students, ranging from a loss of 30 students to a gain of 90. Sixty-six schools provided that data.
To put these numbers in some perspective, in the fall of 2017 – the most recent year with national data – the average private school, including pre‑K students in schools that also had at least one grade kindergarten or above, enrolled 176 students. A gain of 13 students would be a 7 percent enrollment increase, and 7 students a 4 percent increase.
Pandemic Closures Estimate
In addition to our enrollment findings, we were able to estimate possible permanent closures at least partially connected to the effects of the pandemic. This has a much lower margin of error, +/- 3 percent.
Of 800 randomly selected schools, we were able to obtain at least some type of contact information – website, email address, telephone number, or ground mail address – for 764 institutions. Of those, 37 declined the survey, and we sent surveys to 585 schools electronically and 144 by ground mail. Six ground mail surveys bounced back for which we were unable to find additional contact information. Through our searches for contact information, we discovered 26 closed schools, and we failed to contact 10 schools which we subsequently discovered could possibly have been reached. One of those ten had declared that it would close but subsequently announced it would remain open. Finally, one school informed us it had closed via its survey response. That resulted in 791 schools for which we had some information, and put total closures, based on federal data collection in fall 2017, at 27 confirmed, plus 6 possible based on ground mail bounce-backs.
How many closures could reasonably be attributed to the pandemic? What follows are low, high, and middle estimates.
We were able to determine the specific closure year for 16 schools, and only 5 occurred in 2020 and 2021. Of those five, we were able to confirm that COVID played a role in the closure decision of one. For the remaining four, one was confirmed as not COVID-related and three were indeterminate. The low-end estimate of closures, based on closures confirmed as connected to the pandemic, is just one, or 0.13 percent of our sample of 791 schools with contact information or confirmed closure statuses. Nationally, that would translate to 41 schools, which falls well below the count of 144 confirmed closures on our COVID-19 closure tracker.
For the high-end estimate, we have 33 confirmed or possible closures, out of which 12 were confirmed as happening outside of the pandemic year or as not connected to COVID-19. The remaining 21 represent 2.65 percent of our sample, extrapolating to 862 schools nationwide.
For the middle estimate, we include schools that could have closed due to COVID-19, but adjust the two big clusters – 9 Google-reported closed and 6 mail bounce-backs without other contact information – to the proportion of schools we could confirm closed due to COVID and for which we know closure years. One out of 16 schools for which we had closure years was confirmed closed due to the pandemic, or 6.25 percent. Applying that to nine Google closure reports and six bounce backs yields 0.94 schools, or essentially 1 school. Adding that to one confirmed COVID closure, one email reported closure, one telephone reported closure, and three possible COVID closures in 2020, yields seven schools. That translates into a COVID closure rate of 0.88, or 287 schools. Based on our tracker of confirmed closures, this seems like the most reasonable estimate.
Methodology
We selected 800 schools from the federal government’s Private School Universe Survey, which contains 22,838 schools that had at least one grade in the K‑12 range. The Private School Universe survey, importantly, does not have data for about 10,000 private schools which did not complete their surveys. The federal government pegs the full private school population at 32,461. We found contact information or confirmed closure status for 791 schools. We sent surveys to schools with useable contact information, and which did not decline our survey if we contacted them by telephone asking for an address. Schools that received the survey electronically also received several reminders to reply. The survey was conducted between September 7, 2021 and October 15, 2021, and included a small incentive to respond: a free Cato Pocket Constitution. Schools for which we only had physical addresses received a hard copy survey with a pre-stamped return envelope and no reminders to reply. Those completers also would receive a Pocket Constitution.
Shortcomings
The biggest concern with our results is the small response of 69 total schools that provided full or partial enrollment information. That creates a large +/- 12 percent margin of error at the 95 percent confidence level. It is somewhat surprising based on our response last year, in which we received 62 useable responses. That is only a 7 school increase despite doubling our initial sample: from 400 to 800 schools. Our response rate was only 8.5 percent, versus 16 percent last year. We also conducted our survey over a longer period of time this year, employed an easier-to-use electronic format, and offered a small gift that we did not have last year.
Based on the breakdown of schools by type, our sample appears only roughly proportionate to the overall population of private schools. Christian, non-denominational schools constituted 13.2 percent of our respondents, versus 14.0 percent of all private schools in 2017–18. Catholic schools were 11.8 percent of our sample but 21.7 percent of private schools in 2017–18. Non-religious schools constituted 22 percent of respondents, versus 33.6 percent of all private schools.
One possible explanation for our decreased response rate is that last year private schools were more eager to tell their story as they faced potentially daunting enrollment losses, and hoped to be incorporated in federal COVID-19 relief proposals. Our questionnaire was also a bit longer this year, with the added question about enrollment changes over the course of the previous year.
In addition to our small response, there may be fundamental differences between schools that received our survey electronically and by ground mail. From 585 surveys sent electronically we received 54 responses (though one with no data) for a 9 percent response rate. Of the 144 schools sent via traditional mail, 18 responded, for a 13 percent response rate. We also received 10 bounced back mail surveys.
There are also limits to the federal database from which we drew our sample, which while large, only contains data for schools that responded to the federal government’s survey. The remaining roughly one-third of schools may differ in fundamental ways from those that answered. Also, the last year with data is 2017, so any schools that opened since then would not be included.
New Private School “Health” Tracker
The federal government, given its established data collection, is best positioned to report comprehensive information on private schools. That said, Washington does not update its data in a timely fashion; 2017 was four years ago.
To help fill the gaps between comprehensive surveys, and to keep a permanent finger on the pulse of private K‑12 schooling nationally, today Cato CEF launched a new Private Schooling Status Tracker. The new tracker is an adaptation of our COVID-19 Permanent Private School Closures tracker, which, our evidence suggests, has outlived its usefulness, not having registered a new COVID-connected closure since July.
The new tracker displays dashboards for announced private school closures as well as openings for roughly the current academic year, starting with any announcements on or after August 1, 2021, and ending July 31, 2022. We will restart the dashboard at the beginning of each school year, but the page contains links to full Google docs, open to the public, of all closures and openings we have recorded since the start of our tracking in March 2020. The new tracker also displays the basic findings of our enrollment survey for the current school year.
Like our survey, our tracker is not comprehensive: Opening and closing numbers are overwhelmingly derived from media reports, and not only might not every closure be reported by the media, we might not see every report. We welcome any reports of school openings or closings from the public, which can be sent to Center for Educational Freedom Director Neal McCluskey.
