I reported here a couple of weeks ago that at the mid-point of his term President Obama had narrowly exceeded 50% compliance with his Sunlight Before Signing pledge. Now it’s time to do some more analysis of how he has implemented his promise to post bills Congress sends him online for five days before signing them.
In a post late last year, I graphed the president’s improvement over time. His first year in office was dismal, but things got quite a bit better in the second year.
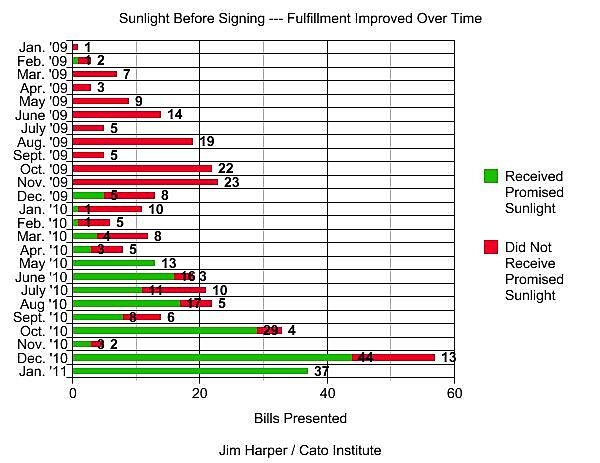
We can now graph the entire first half of the term, which confirms that improvement. (Click graphs for full-size images.) Compliance could easily have been better in December, but the graph shows 100% success in the first twenty days of January, which brings us to the exact mid-point of the term.
Now, 87 of the bills signed into law during the last Congress renamed a post office or other federal facility, and a couple dozen more were purely ceremonial or perfunctory. (Congress has a strange fixation on coins.) These matter quite a bit less than the bills that have a significant effect on government policy, and many passed at the end of the year. This raises the question: Do these “gimmes” inflate the president’s success rate?
So I cast around for some way to adjust the graph to reflect the “importance” of legislation. This might show us that the trivial bills get tanned and rested in sunlight, while the important ones are hustled through in the dark of night—fat and pale.
I thought of two potential proxies for importance: the attention Congress paid bills on their way through, and the number of pages in bills.
Sixty percent of the bills Congress passes go through without a final vote on passage in either house. Trivial bills regularly fly through the House on a voice vote. In the Senate it’s most often unanimous consent. Sometimes one house or the other takes a vote. It’s usually the House taking what’s called “suspension” vote. (“Suspension of the rules” is a procedure for fast-tracking non-controversial bills.)
In the number of votes taken on a bill, we have a rough proxy—very rough—for importance. Generally, a bill subject to one vote on final passage is more important than one subjected to no vote. And in general a bill subjected to two passage votes is more important than a bill subjected to just one or zero votes.
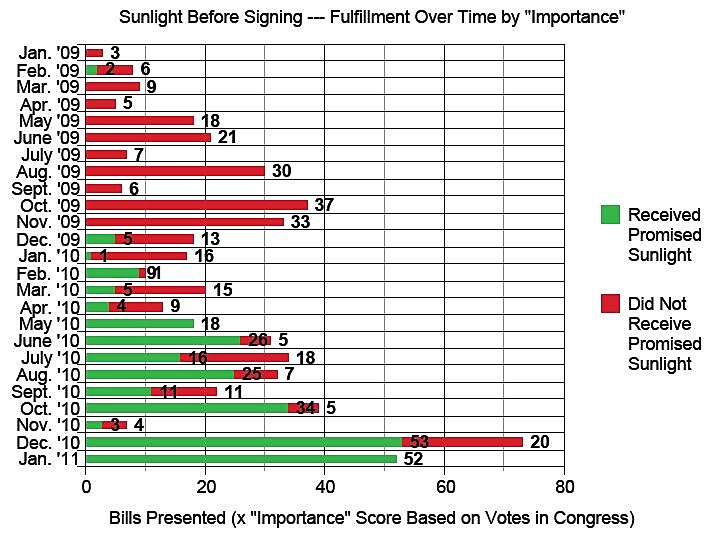
So I took the bill counts you see graphed in the first chart and used a multiplier on “bills presented” to show importance according to this proxy. The bills getting no vote got one point, bills getting one vote counted as two points, and bills getting two votes counted as three points.
The results, as you can see to the right are pretty similar. “Importance” as reflected in congressional voting doesn’t change things much.
But sometimes Congress forgoes votes on important bills. It’s hard to be sure exactly why, but it’s probably because the political balancing is so sensitive. (Public Law 111–8, the Omnibus Appropriations Act, 2009, is an example. It got no vote in the House or Senate, though it contained hundreds of pages of instructions about how hundreds of billions of dollars would be spent.) Maybe there is no change between the two graphs because Congress and the president think alike about hustling through important bills.
So what about page counts? The number of pages in a bill is a second proxy for importance—one that Congress and the president can’t mask by treating certain bills with equal haste. It’s generally true that a higher page-count means that a bill has greater importance to the country. Obamacare was 906 pages.
This proxy is not 100% accurate. Public Law 111–322, the Continuing Appropriations and Surface Transportation Extensions Act, 2011, spent about $7,500 per U.S. family in just 14 pages of bill text. Using page-counts probably underweights its importance.
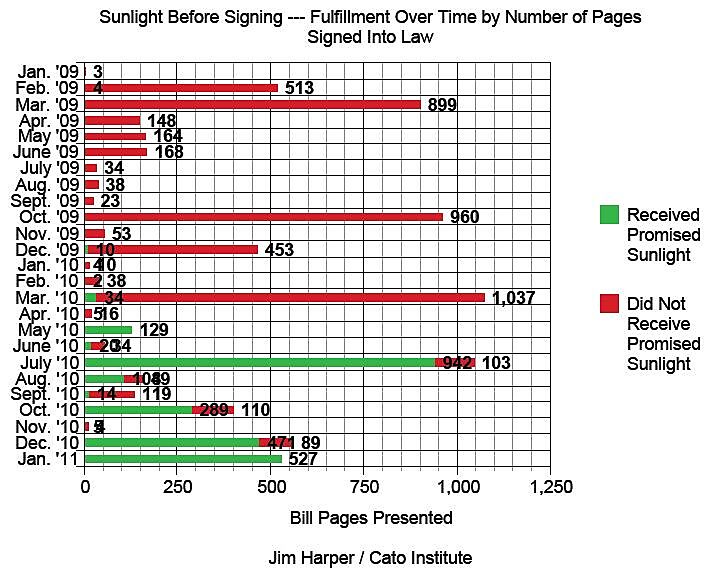
A graph showing the number of pages given sunlight versus the number of pages not given sunlight looks quite different.
It doesn’t upend the story that the Obama administration improved on Sunlight Before Signing over time—it did. But it shows that Congress and the president were more aggressive during the early part of the 111th Congress. During the latter stages, their ambitions dropped while the president began to execute on his “good government” Sunlight Before Signing promise.
March and October 2009 were two months when the president’s failure on Sunlight Before Signing are acute. Around 900 pages of legislative text didn’t get the public airing the president had promised.
But March 2010 is the stand-out in this chart. At this time, the president had begun to implement Sunlight Before Signing. He was 4 for 12 overall that month. The most significant legislation of his term so far—Obamacare—was not handled consistent with the ideals on which he based his candidacy for president, and the chart shows it. (I didn’t start in looking to reach this conclusion. It’s what I found when I went to see what the big bill was that passed in March.)
Notably, a few months later in July, the president’s remvamp of financial services regulation did get the Sunlight Before Signing treatment. Sunlight is not the death knell for the president’s priorities, of course. It’s a campaign promise he made. Steady execution on it would allow the people to develop the good civic habit of observing what goes on in Washington, D.C. rather than just throwing up their hands. This is likely to reduce demand for government—as a matter of consensus, not just because libertarians were more clever, more media savvy, or politically active over a given stretch of time.
My thanks to the Cato interns who helped with the data-collection drudgery. We’ll keep watching Sunlight Before Signing.
