Professor Paul Campos, something of an antagonist of our higher education system, caused a bit of ruckus last week when he wrote in the New York Times that skyrocketing college prices cannot be blamed on falling state appropriations to schools. The reality, of course, is that declining public support could explain some of the increase in prices (though not much at private colleges) but it seems unlikely it would explain all of the increases.
Let’s look at the trends.
First, note that overall state and local support, at least for general operations at public institutions, is indeed down over the last several years. Using data from the latest State Higher Education Finance report – released just yesterday – total state and local support for general operations at public colleges, adjusted for inflation using a higher education-specific index, fell from a peak of $83 billion in 2008 to $73 billion in 2014, a pretty big drop. That said, in 1989 total spending was only $64 billion, which means it has risen since then.
Of course, there has been a huge increase in public college enrollment since 1989, rising from 7.5 million full-time equivalent students to 11.1 million. So, as you can see from the blue line in the chart below, appropriations per student have definitely dropped. But do those drops explain rising prices?
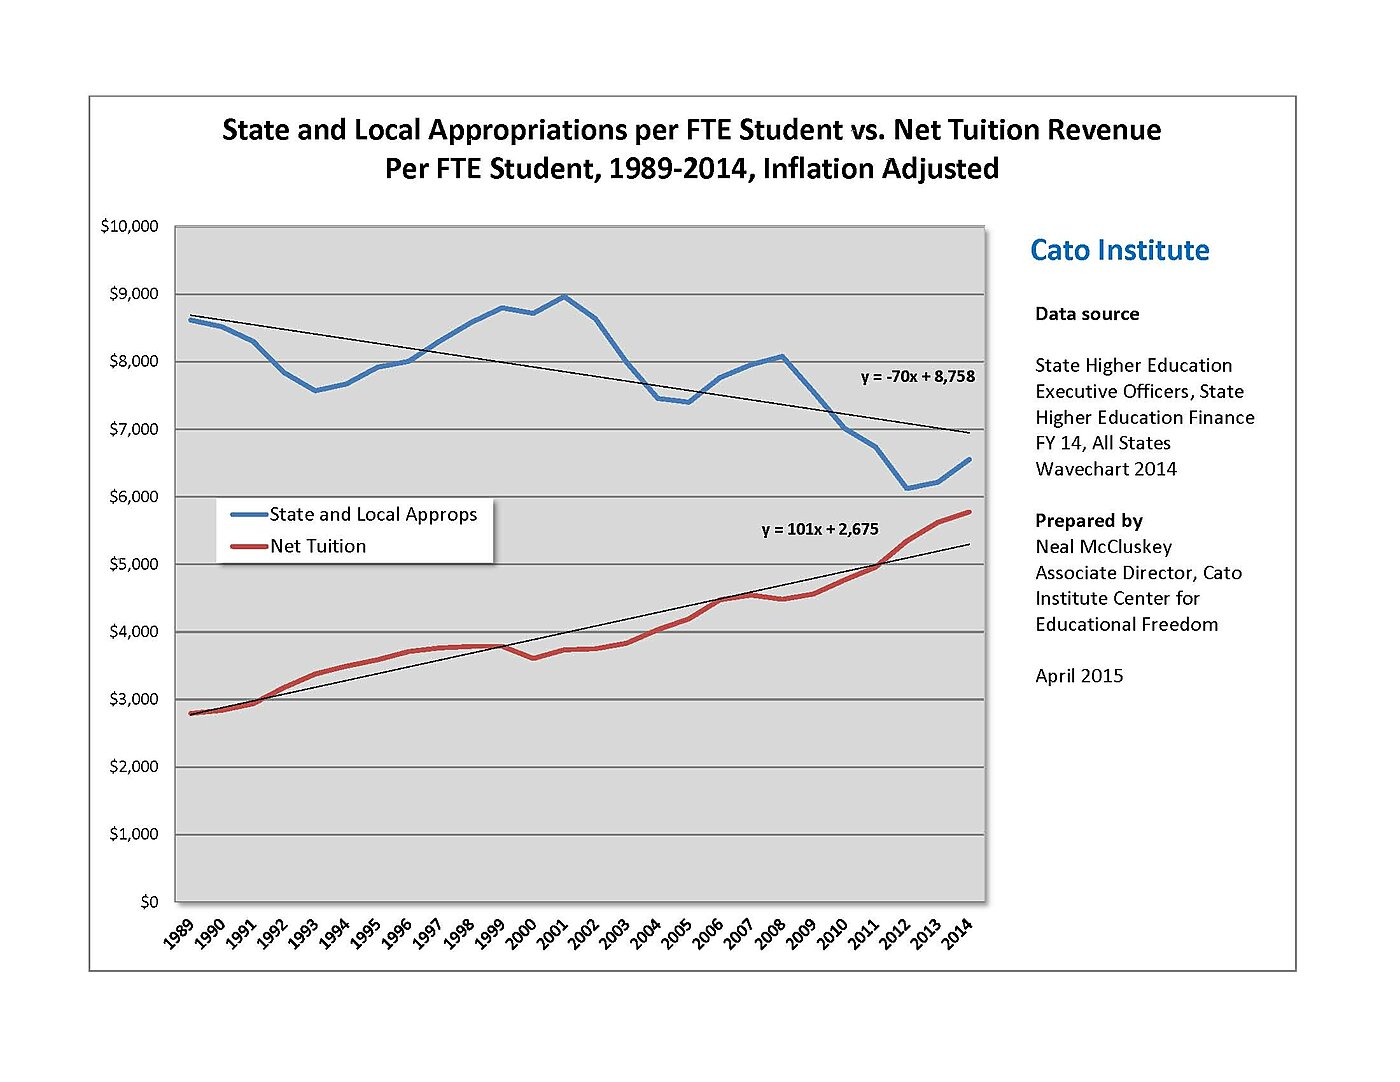
Here is where the red line comes in. Note, the line is revenue received per full-time equivalent (FTE) student after accounting for state and institutional aid to students. What it shows is that net revenue per student has been going up, as expected. But look at the black, linear trend lines, which enable us to get a sense for what the overall trends have been. They show that while public institutions have lost roughly $70 per year, per student, in public appropriations, they have increased their net tuition revenue per-student $101 a year, for an annual net gain of $31.
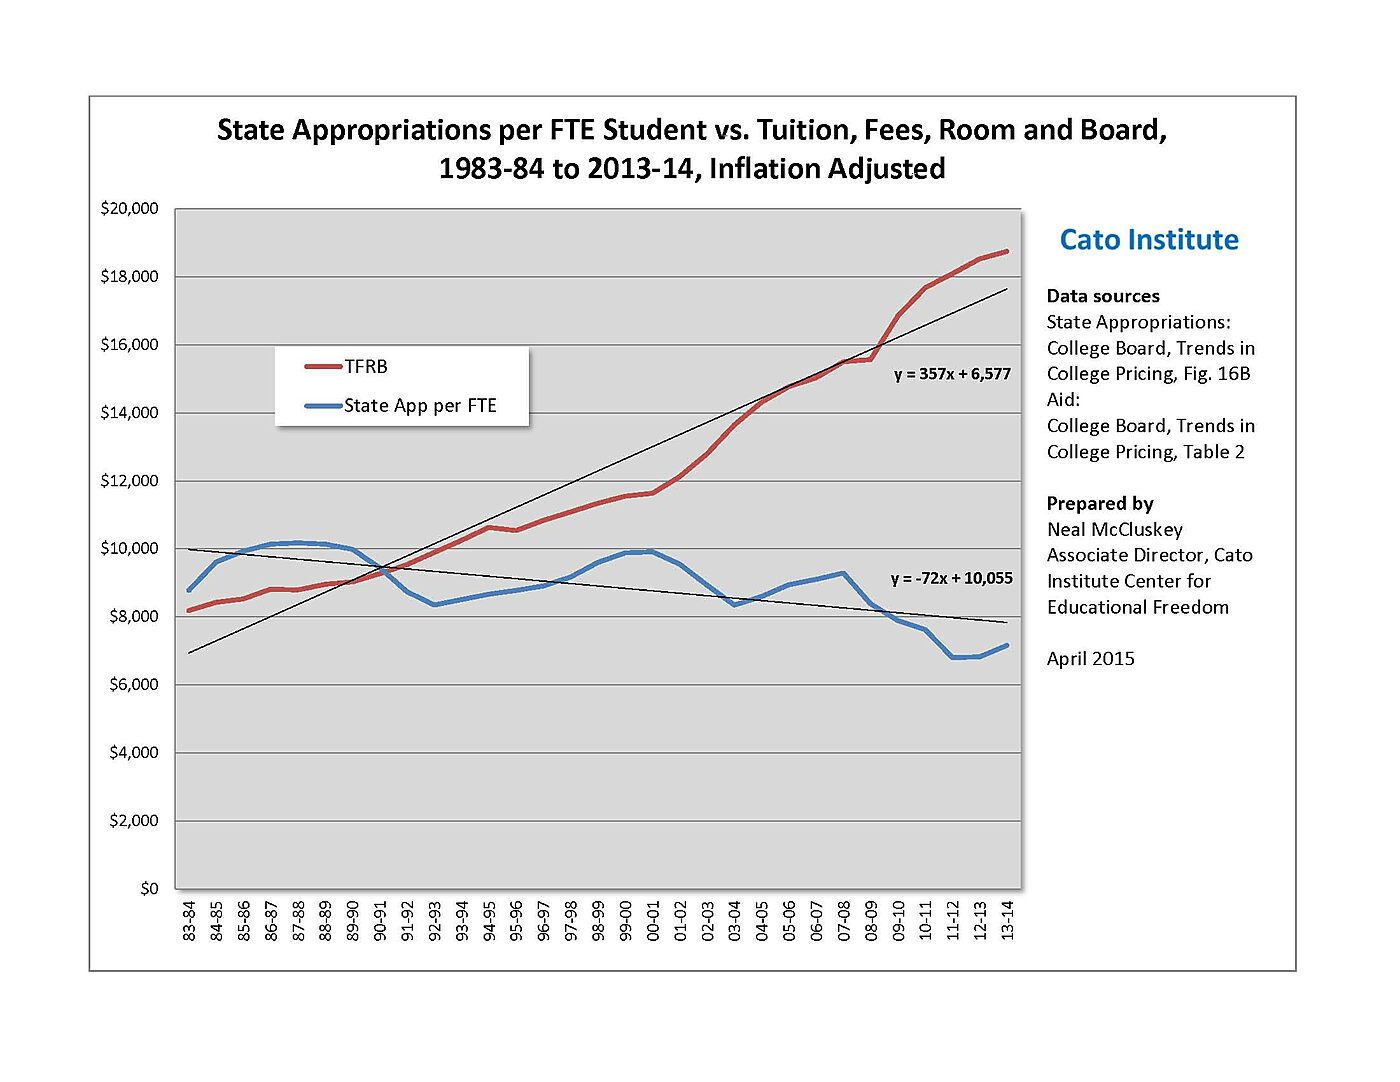
The SHEEO data, however, are not the most damning when it comes to the Cheap States Made Us Do It hypothesis. Data from the most recent College Board pricing report, which capture state appropriations per FTE student and the cost not just of tuition and fees, but also room and board, show a much greater gap between rising college prices and what would be needed to make up for lost public funding. The College Board also uses a standard price index for calculating inflation instead of one tailored to higher ed, the latter of which would overstate past spending were all higher education costs artificially inflated faster than a “normal” basket of goods. Say, perhaps, by huge subsidies to consumers.
As the chart below illustrates, while public institutions have lost about $72 per FTE student each year using College Board data, they have increased published tuition, fee, room and board charges about $357 per year. That’s a hefty net gain of $285 per student, per year.
So what do these charts show us? What I have written before, and what Campos just argued: More is going on in rampantly inflated college pricing than just lost state funding. Almost certainly much more.
