Today marks the 50th anniversary of the first celebration of Earth Day. The Simon Project is happy to announce the release of The Simon Abundance Index 2020. This year’s Index covers the period between 1980 and 2019.
The main findings of the report are as follows:
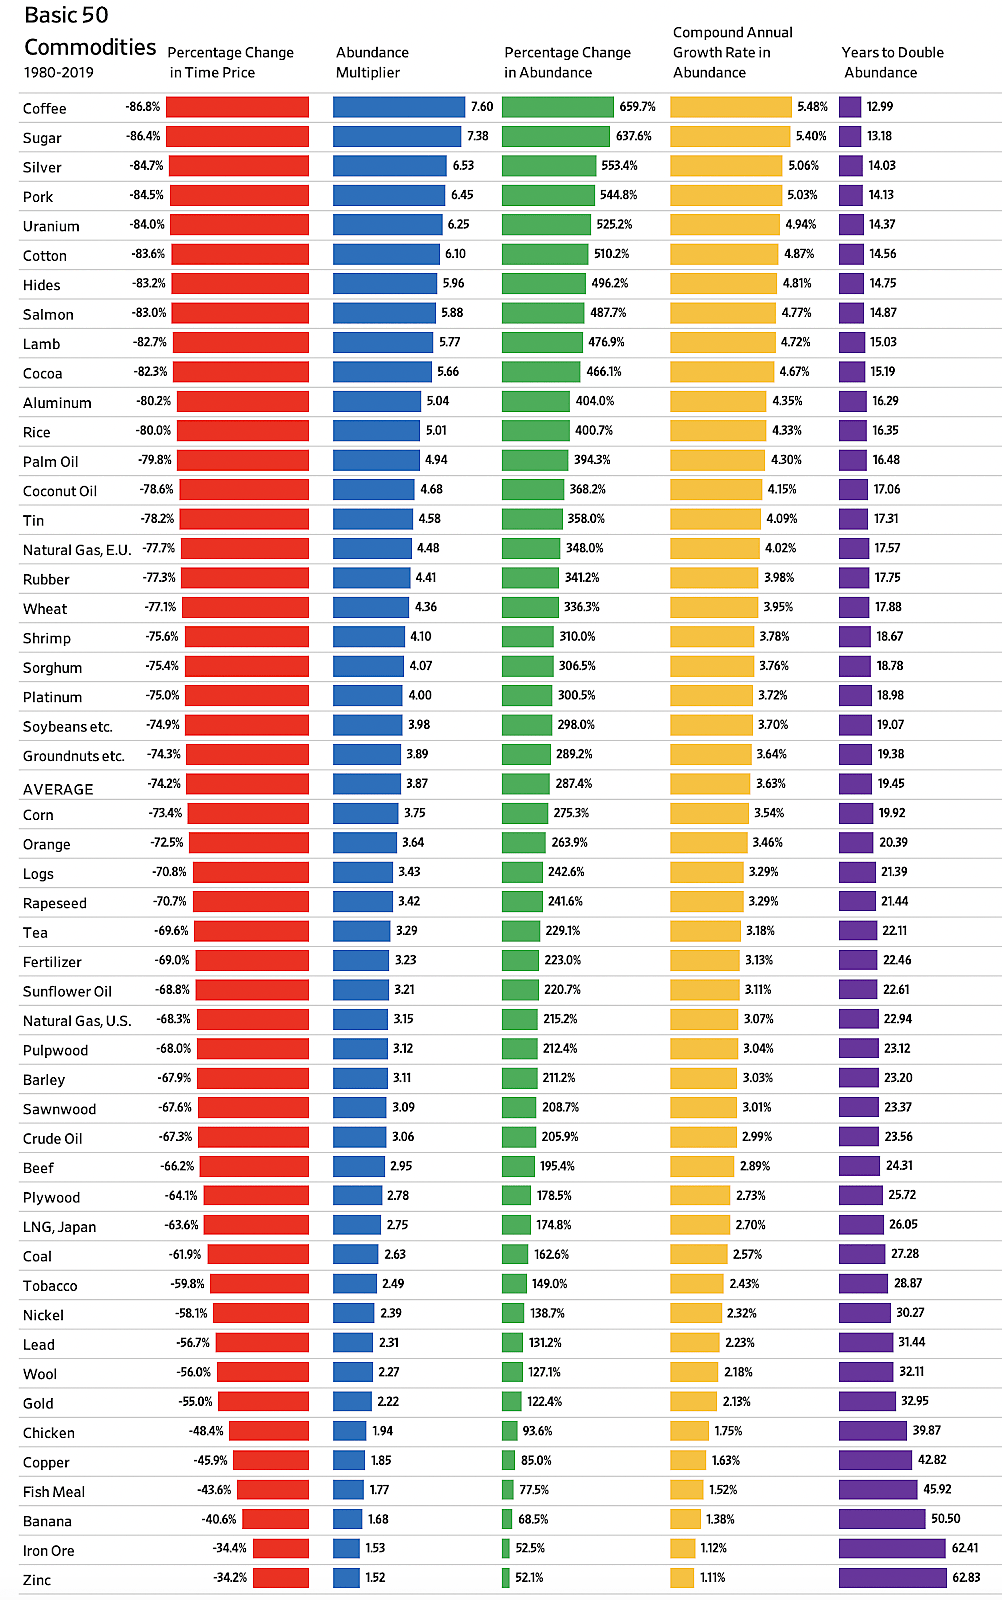
Between 1980 and 2019, the average time price of 50 basic commodities fell by 74.2 percent. That means that for the same length of time that a person needed to work to earn enough money to buy one unit in our basket of 50 commodities in 1980, he or she could buy 3.87 units in 2019. The average individual level of abundance, in other words, rose by 287.4 percent. That amounts to a compound annual growth rate of 3.63 percent and implies a doubling of abundance every 19.45 years.
The price elasticity of population (PEP) allows us to measure sensitivity of resource availability to population growth. Between 1980 and 2019, the world’s population increased from 4.458 billion to 7.677 billion or by 73.2 percent. The time price of commodities fell by 74.2 percent. As such, the time price of commodities declined by 1.014 percent for every 1 percent increase in the world’s population. Put differently, over the last 39 years, every additional human being born on our planet appears to have made resources proportionately more plentiful for the rest of us.
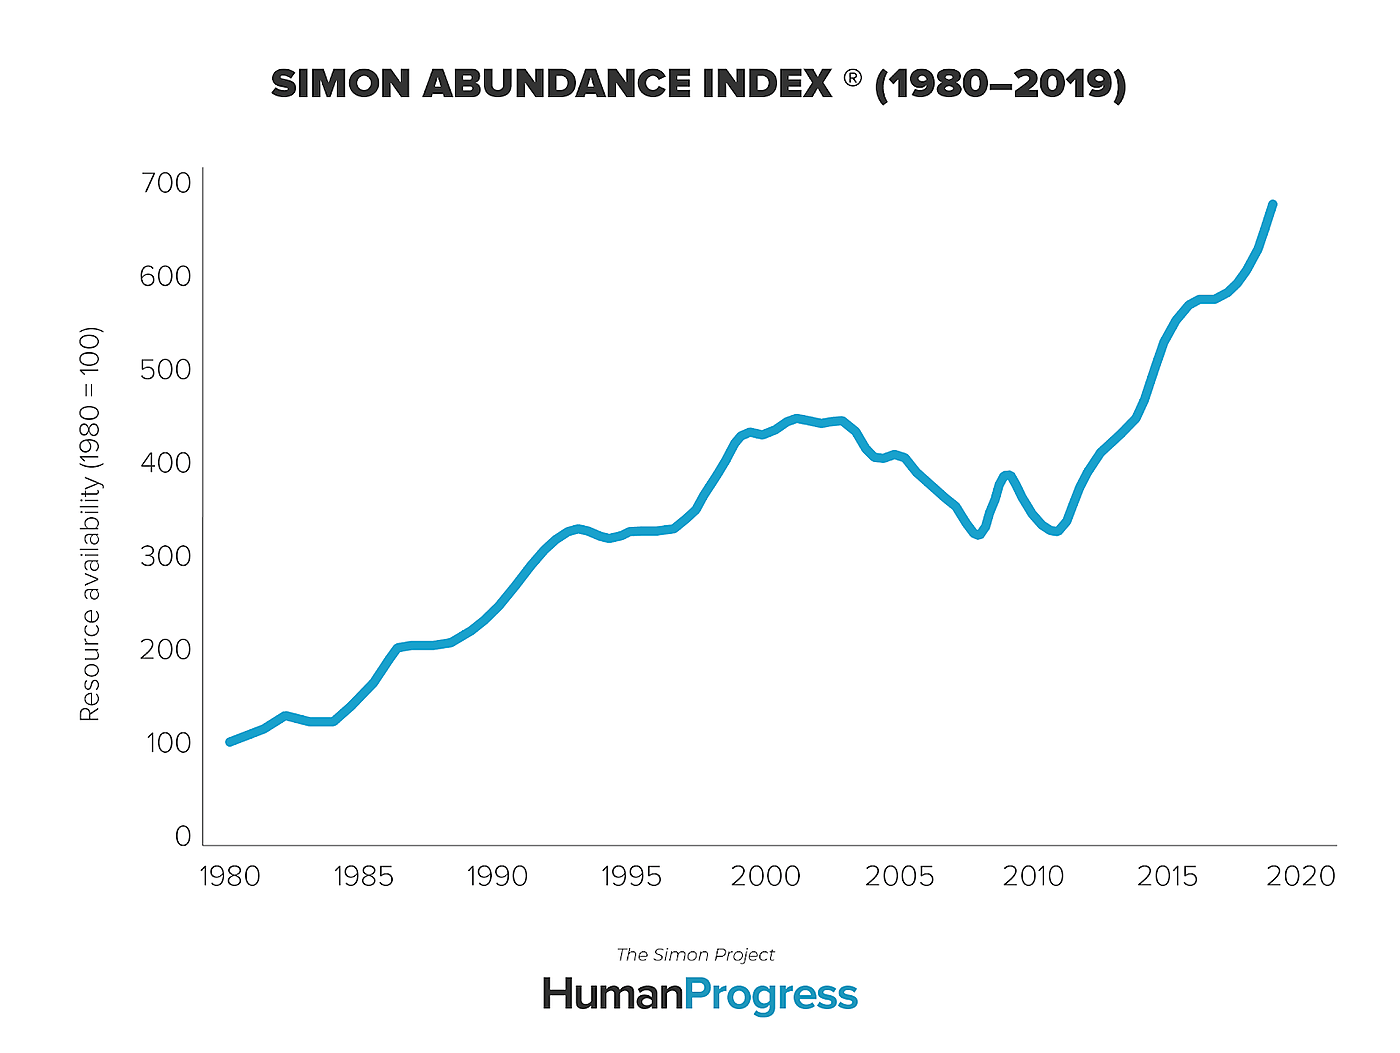
The Simon Abundance Index uses the time price of commodities and change in global population to estimate global resource abundance. The Index represents the ratio of the change in population over the change in the time price, times 100. It has a base year of 1980 and a base value of 100. In 2019, the Index reached a level of 670.9. That is to say that the Earth as a whole was 570.9 percent more abundant in 2019 than it was in 1980.
The accompanying video can be found here.
