Every once in a while, something truly bizarre gets published in the climate business. The latest iteration would be “Higher CO2 Concentrations Increase Extreme Event Risk in a 1.5°C World”, published online on June 12th in the prestigious Nature Climate Change by Baker et al.
The extreme events under consideration include
1) days hotter (less cold) in the summer (winter) than the 90th percentile of current temperatures at a given location,
2) a measure of atmospheric stickiness called the “wet bulb globe temperature”, expressed as its 95th percentile for the amount of moisture in near-surface air at a given location, and
3) the 95th percentile rainfall on days when it rains.
The paper claims that carbon dioxide itself will “have a significant direct impact on Northern Hemisphere summer temperatures, heat stress, and tropical precipitation extremes”. That’s what it claims, but it is really not what it shows.
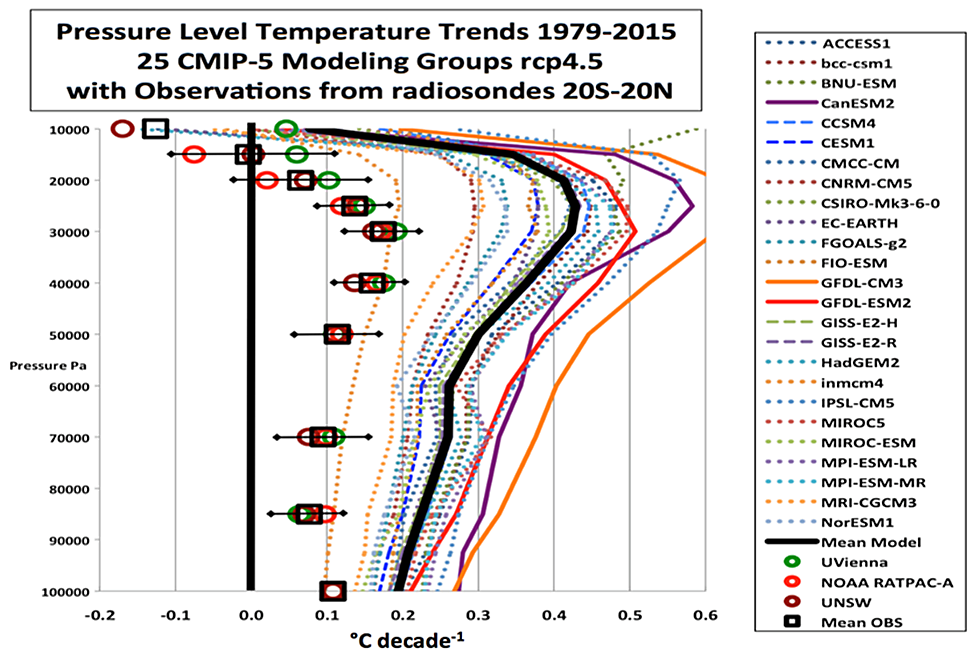
The problem is, as readers of these posts know, that the climate models are making horrific errors with regard to warming rates in the tropical upper troposphere. The difference between near-surface and upper temperatures determines whether and/or how much it rains. When the difference is large, the surface air is more buoyant, and thunderstorms explode. When it’s small, the atmosphere is more stable and dry.
So how could the authors find a “significant” impact on heavy tropical precipitation? Simple, just sweep the error under the rug. They took a model with the CO2 of the current era and subtracted its calculated precipitation from other models with ranges of carbon dioxide changes consistent with a total warming of 1.5°C.
Yes. The modeled precipitation for the present, with all of its upper tropospheric errors (shown yet again below), was subtracted from the modeled precipitation for the more-CO2 models, with all of their upper tropospheric errors.
Hint: subtracting two wrongs does not make a scientific right.
Figure 1. Predicted warming rates with height, expressed on the y‑axis as atmospheric pressure. The colored spaghetti is the average of each model family listed on the right, the solid black line is the average of all the models and the actual (observed) values are within the ovals on the left. Models used in the recent paper include MIROC5 and a version of HadGEM2, both of which are far too warm at elevation in the tropics.
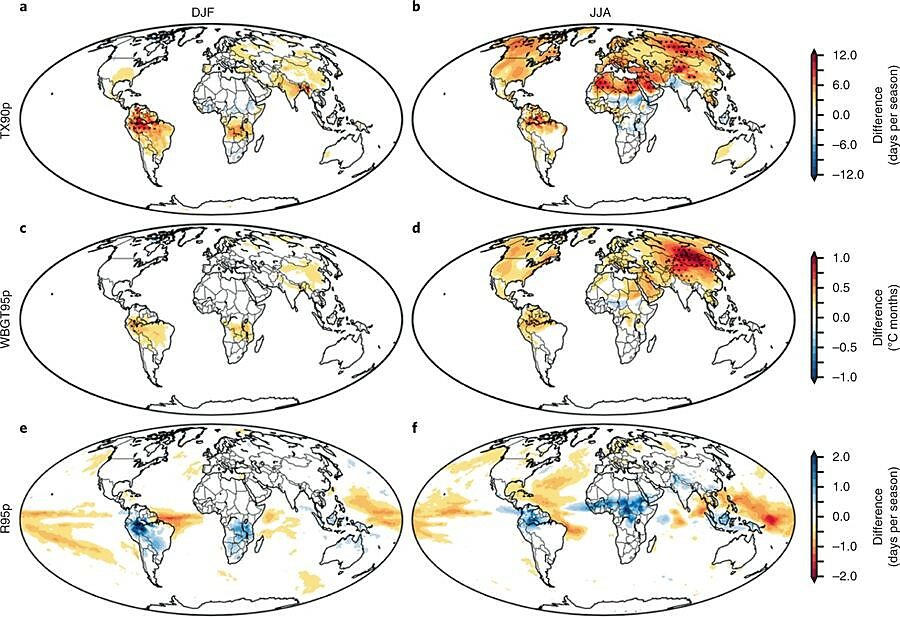
Let’s zero in on that “significant direct impact on…tropical precipitation regimes”. Figure 2 e‑f gives the change in the number of wet days above the 95th percentile. A close squint reveals that the range of change is from about two more wet days per season to about two less.
As for the significance, the figure caption in Nature Climate Change, says there’s stippling on the maps when the change is significant at the 10% level (a very lax criterion by science standards). There’s no stippling on the precipitation maps, meaning none of the forecast changes are significantly different than the present, despite what the paper says.
Figure 2. Top: change in number of hot days per season; Middle: change in the “stickiness” temperature; Bottom: change in number of wet days per season. None of the precipitation changes (“e” and “f”) are significant, despite what the text says, and there is only limited significance in the other four maps, depicted by the stippling. Notice that the precipitation changes in the negative (orange) direction (fewer heavy rain days) are about the same as those in the opposite (blue) direction. From Baker et al., 2018.
There are some stipples—but not many—on the maps for relatively warm days, and on the maps for sticky days. They concentrate in June-August over the Sahara Desert (which will have the profound effect of turning it into a desert) and Siberia, where warmth might be somewhat welcome there, both by the residents and the black flies.
You can scratch your head as to how the peer-reviewers of this manuscript would allow the abstract of the paper to boldly claim “significant” changes in wet days in the tropics when there were none.
The ubiquitous nature of these types of shenanigans—and it’s not just in climate science—is what prompted me, along with Cato Scholar Terence Kealey, to write and edit Scientocracy:The Tangled Web between Science and Public Policy, currently under editorial review.


