We’ve looked at the K‑12 spending trends both nationally and in restive states, broken down per-pupil expenditures into smaller bits, and added North Carolina. I had planned to finish this spending series with this post, but there are a lot of data to examine so I’m going to put off conclusions to the next—and final—post. We now look at total enrollment and inflation-adjusted expenditures, and then at how staffing and inflation-adjusted teacher salaries have moved, both nationally and for our “hot” states. (On all charts, pay close attention to the horizontal axis. Many start with wider increments of time than they end.)
National
Enrollment: We saw a drop between the 1969–70 school year and 89–90, then enrollment lagrely plateaued between 05–06 and 13–14.

Spending: Total public school revenues (standing in for spending because a longer trend is available) massively increased between 69–70 and 07–08—the Great Recession—at which point they started dropping, but as of 14–15 they had essentially returned to pre-recession levels.

Teacher Salaries: Average salaries for public school teachers have been pretty stagnant since the late-1980s. The period we have been focusing on intensively—99–00 to 14–15—shows salaries peaking in 09–10, then failing to recover to levels at the beginning of that period.

Teacher Staffing: Public schools have been hiring teachers faster than enrollment has risen, starting at 4.5 teachers per hundred students in 1970 and hitting 6.5 in 2008. It dipped to slightly above 6.2 in 2014.

Non-Teaching Staff: Other staff have been rising relative to teachers, with teachers dropping from 51.5 percent of total staff in 2000 to 49.4 percent in 2015.

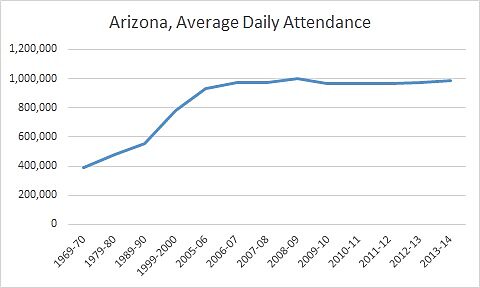
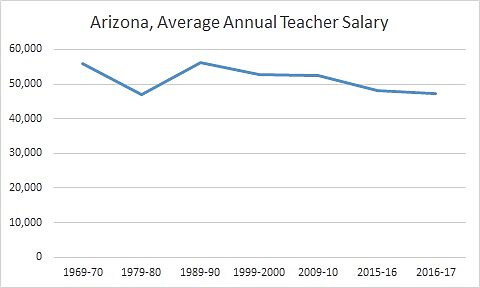
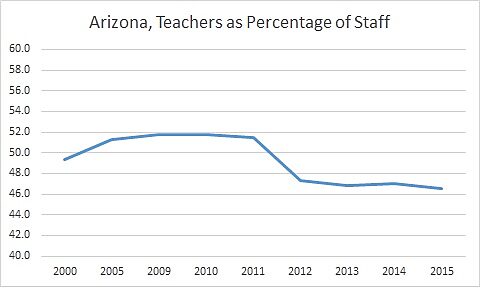
Arizona
Enrollment: Arizona saw a huge increase in average daily attendance, with numbers doubling between 69–70 and 99–00, while national numbers barely moved. Even between 99–00 and 05–06 Arizona’s enrollment increased about 19 percent while nationally it rose only about 5 percent.
Spending: State-level, inflation-adjusted total spending between 99–00 and 14–15 grew from about $8.4 billion to $9.7 billion, with a peak of $12.1 billion in 06–07.

Teacher Salaries: Teacher salaries have generally been dropping, especially since 89–90.
Teacher Staffing: Between 2000 and 2015 the number of teachers per 100 students fell from a little over 5 to a bit over 4.

Non-Teaching Staff: It’s been growing relative to teachers. In 2000 teachers were 49.3 percent of all staff. In 2015 they were just 46.5 percent.
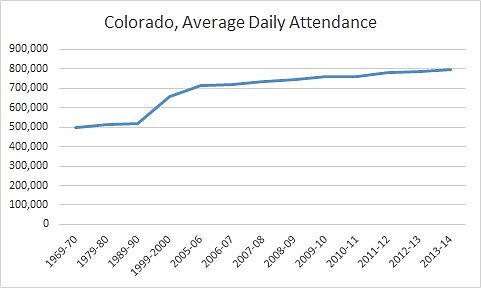
Colorado
Enrollment: Like Arizona, Colorado saw enrollment increase at rates that exceeded those of the nation, with attendance rising 31 percent between 69–70 and 99–00. Enrollment continued to rise throughout the period.
Spending: Grew from $7.7 billion in 1999–00 to $9.6 billion in 14–15, and peaked in 07–08 at $10.3 billion.

Teacher Salaries: Salaries have fallen since 69–70 and 99–00. Since 99–00 they have dropped 15 percent.

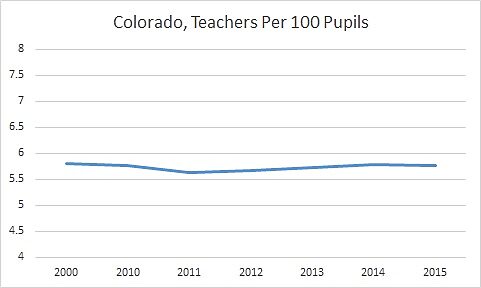
Teacher Staffing: This has hovered pretty steadily around the 5.7 teachers per 100 students mark.
Non-Teaching Staff: We see a relative increase in non-teaching staff. In 2000 teachers comprised 50.7 percent of total staff. In 2015 it was down to 46.3 percent.

Kentucky
Enrollment: The story is very different from the two western states, with big drops in enrollment between 69–70 and 99–00. Enrollment has rebounded since 99–00, but still has not returned to 69–70 numbers.

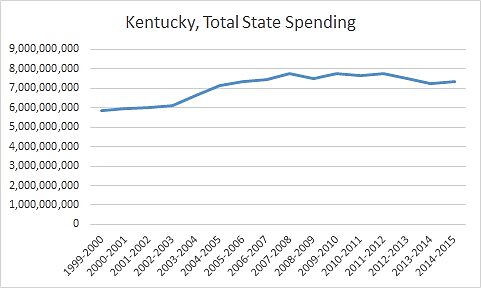
Spending: Outlays rose appreciably between 99–00 and 14–15, and only took a small dip after peaking at almost $7.8 billion in 09–10.
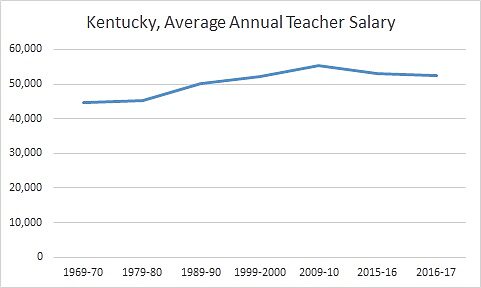
Teacher Salaries: These grew steadily between 69–70 and 09–10, rising about 24 percent, but have since slipped back a bit.
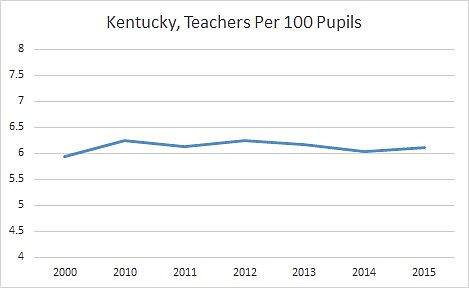
Teacher Staffing: Since 2000, teachers per 100 students has stayed pretty steady at about 6.1.
Non-Teaching Staff: Again we see a relative increase in non-teachers, though not as big as in the previous two states, and starting from lower levels. Teachers made up only 44.1 percent of total staff in 2000 and 42.9 percent in 2015.

North Carolina
Enrollment: The Tar Heel State saw a slightly faster rate of growth between 69–70 and 99–00 than the nation as a whole, but not like AZ and CO. It has seen pretty steady but not steep increases since then.

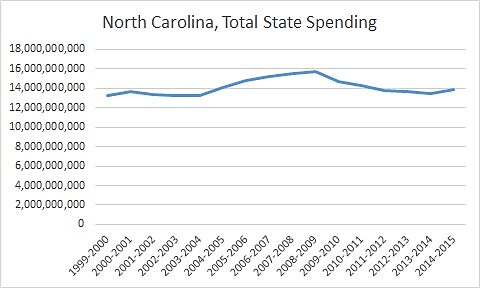
Spending: The state saw big fluctuations, rising by about $2.4 billion between 99–00 and 08–09, then declining by roughly the same amount between 08–09 and 13–14.
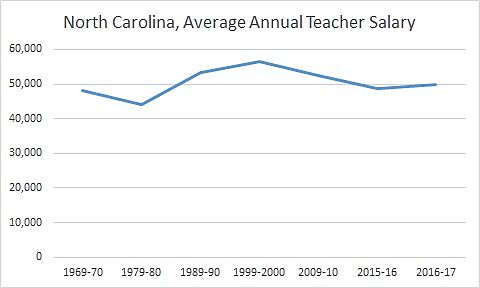
Teacher Salaries: This has been a bit of a roller coaster, peaking in 99–00, but shedding almost 12 percent of value since.
Teacher Staffing: Pretty steady at about 6.5 teachers per 100 students.

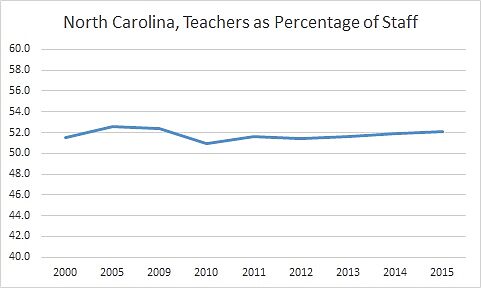
Non-Teaching Staff: North Carolina has seemed to avoid the admin bug, with teachers as the percentage of all staff saying steady at about 52 percent.
Oklahoma
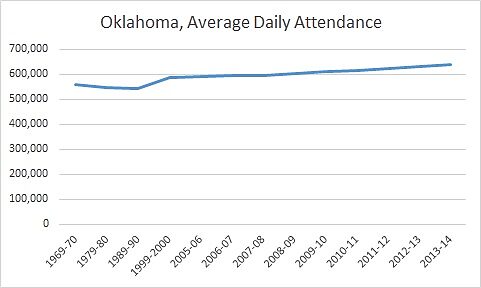
Enrollment: Since 99–00 steady growth, but only for a 9 percent total increase.
Spending: Has been on a gradual upswing, with just a small recession dip from which the state recovered after just three years.

Teacher Salaries: Spiked in 09–10, but returned to just a bit above the norm in 16–17, sitting at $45,245.

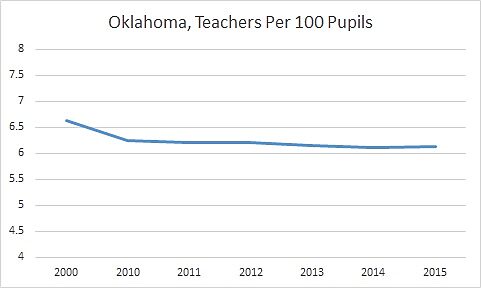
Teacher Staffing: Oklahoma has decreased the number of teachers per 100 pupils since 2000, dropping from about 6.6 in 2000 to 6.1 in 2015.
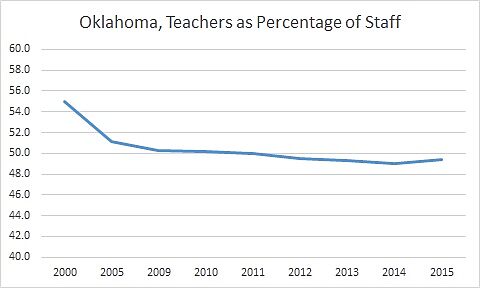
Non-Teaching Staff: While decreasing teaching staff, Oklahoma has seen appreciably increasing non-teaching employees, with teachers constituting 55 percent of total staff in 2000, but only 49.4 percent in 2015.
West Virginia
Enrollment: This state hemorrhaged enrollment between 69–70 and 07–08, falling 28 percent, and it has hovered around 271,000 since 99–00.

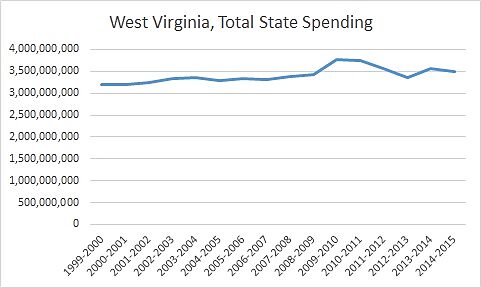
Spending: Spending spiked between 99–00 and 09–10, and after dropping significantly is still about $286 million above where it was to start the period.
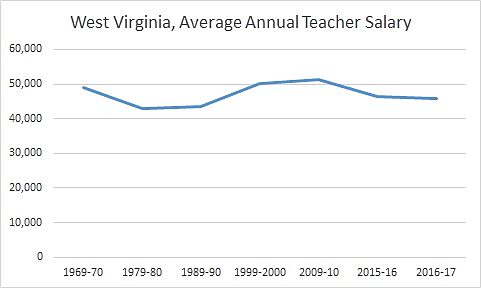
Teacher Salaries: These peaked in 09–10, but have dipped below their 69–70 mark of $49,141.
Teacher Staffing: Teachers per 100 students dipped slightly since 2000.

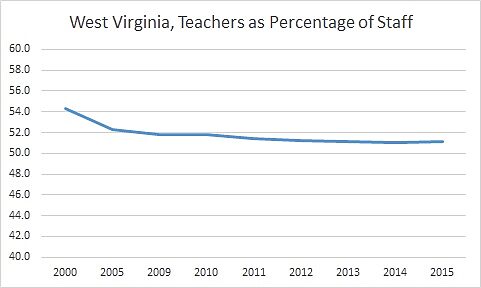
Non-Teaching Staff: Administrative and support staff have been rising compared to teachers. Teachers made up 54.1 percent of total staff in 2000, but were down to 51.1 percent in 2015.
Next Time
That’s it for now. I’ll sum up what I think all these data tell us in the upcoming, final post.
