With “Red for Ed” walkouts continuing in Arizona, and ongoing discussion about how well public K‑12 schooling has been funded nationwide, here’s part three of our impromptu series on spending. As promised last week, this post presents the total spending charts for the five states that have been most in the news over funding: Arizona, Colorado, Kentucky, Oklahoma, and West Virginia. Please see the previous posts for discussions of national spending levels and data sources. The data here are total, inflation-adjusted, per-pupil expenditures on public elementary and secondary schools.
Arizona
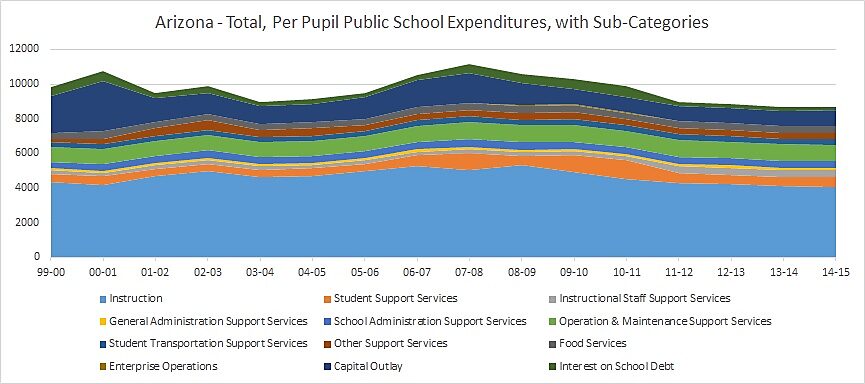
Things are looking down in AZ, though with a similar pattern to the nation overall: Spending generally rising before the Great Recession—total expenditures peaked in 07–08 at $11,141—then dropping afterwards. Unlike much of the nation, however, for the entire period total spending in Arizona fell, from $9,837 per pupil to $8,697. And it has a somewhat pronounced spending valley before the recession.
Where were the cuts? While all of the various types of support services saw increases for the overall period—and some saw increases even after the recession—instructional spending, which most people would probably consider the nucleus of what schools do, fell 6 percent for the full period, or $281 per student. The biggest loser was capital outlays, which dropped 58 percent for the period, or by nearly $1,300.
Colorado
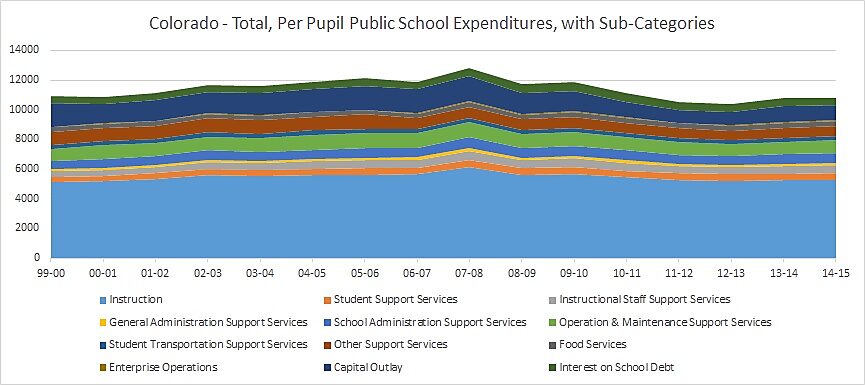
Again we see the pattern of overall spending peaking in 07–08, then falling. We also see a loss from the beginning of the period to the end. But Colorado’s decline is much smaller than in AZ; only $86, or a less-than 1 percent dip.
For the overall period, only two sub-categories of spending saw cuts: capital outlays, which dropped 34 percent, and other support services, which fell about 22 percent. Instructional spending rose by roughly 2 percent and even after the recession fell only 14 percent.
Kentucky
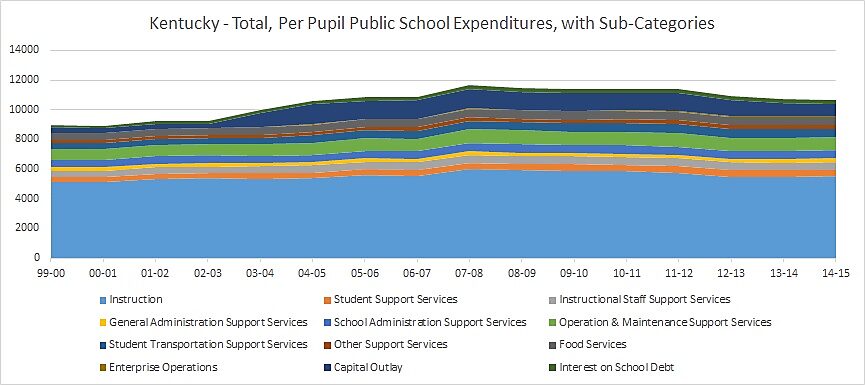
Don’t cry for Kentucky, AZ and CO. The chart for the Bluegrass State is generally one of rising, not falling, spending. Total spending, and all but one subcategory–school administration support services–saw funding increases between the 99–00 and 14–15 school years, and lots of support functions saw increases in the roughly one-third neighborhood. Instructional spending increased nearly 7 percent for the period and capital outlays ballooned by 117 percent. Many areas did see cuts during the recession, but several types of services saw increases even during that period, though of generally small dollar amounts.
Oklahoma
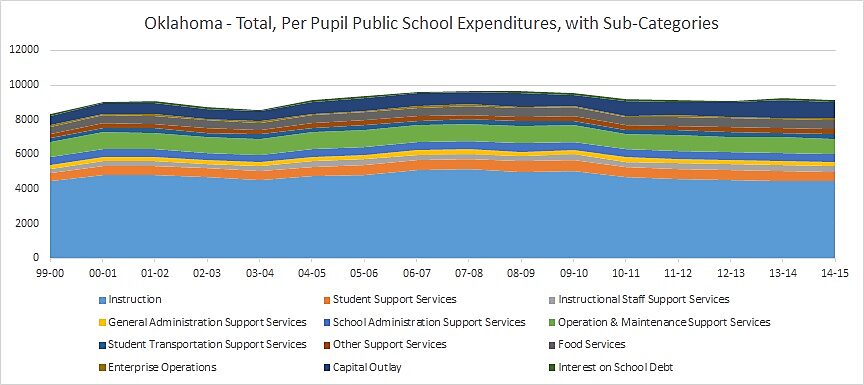
Here’s another case of total spending rising during the full period, from $8,310 per student in 99–00 to $9,114 in 14–15, a nearly 10 percent increase. However, instructional spending barely rose at all—just $7. The biggest increase was in capital outlays, which spiked 79 percent, or by $427. The next largest increase proportionally was for other support services, which increased almost 48 percent. After the recession, instructional spending dropped 13 percent, but capital outlays rose 36 percent, and a couple of support services saw upticks.
West Virginia
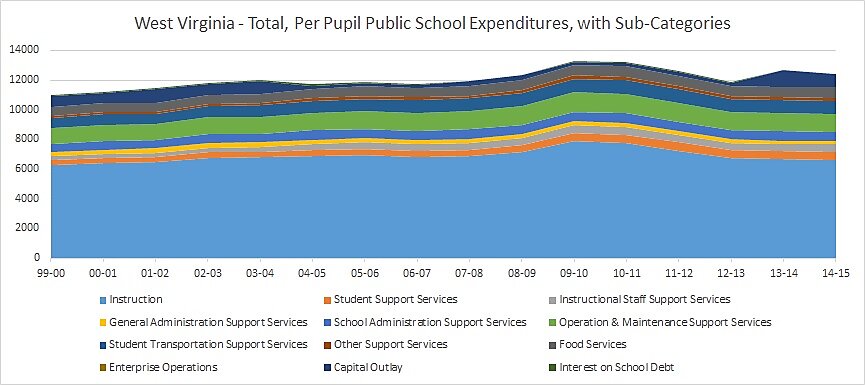
Here’s another state where expenditures have been markedly on the rise, not falling, with total spending rising roughly 13 percent—or by $1,468—over the full period, and even increasing since the recession, by $487. A lot of that was not in instruction, however, which grew by only about 5 percent for the overall period, and dipped by more than 4 percent after the recession. And note that spending peaked after 07–08, unlike other states, hitting its highest level–$13,296—in 09–10.
As we’ve seen elsewhere, some of the biggest increases in percentage terms were in support services of various types, the largest of these in instructional staff support, which approached doubling. Meanwhile, the state appeared to go on almost a capital outlay hiatus between 03–04 and 13–14.
Why?
These five states, while they share unrest over funding in common, look different in various respects, including what kind, when, and how much they have cut or increased spending. In the next post—maybe the last of the series—we’ll look at some possible reasons we see these changes.
