Long-Term, National: Money and Employees Have Poured In
Now that we’ve looked at scads of data—on spending, staffing, salaries—what can we conclude about the state of resources in public schools?
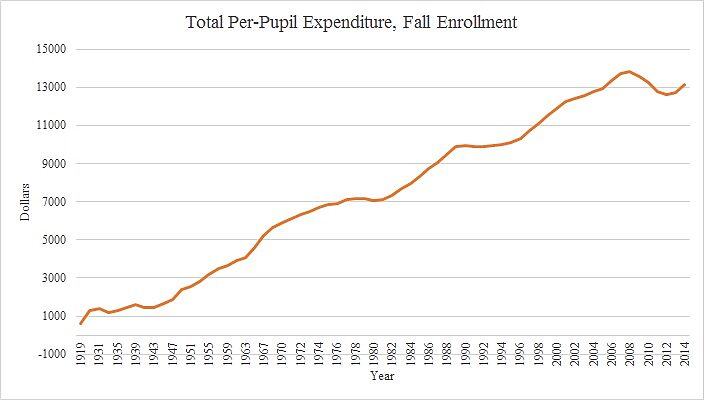
First, we need to recognize that the period since the Great Recession has been an anomaly in nearly a century of education spending. Whether in total or on a per-pupil basis, until the Great Recession we rarely saw spending decrease, especially after 1943. In the 1919–20 school year, adjusted for inflation, we spent $13.2 billion on public elementary and secondary education. In 08–09 we spent almost $690 billion, or about 52 times as much. Of course enrollment also grew—we only spent about 23 times as much per pupil!
What was the magnitude of the retrenchment between the peak spending year of 08–09 and the recession spending trough, 12–13? Total spending fell from about $690 billion to $636 billion, or 7.8 percent. The average per-pupil expenditure dropped from $13,816 to $12,621, an 8.6 percent decrease. Those dips aren’t nothing, but they are hardly catastrophic. And as of 14–15—the most recent year with federal data—total spending was back up to nearly $668 billion, and per-pupil spending to $13,119.
Teaching staff has also increased long-term. In previous posts we went back to 69–70 for data, but could have gone back to 1955 for national-level figures. Between that year and 2008, public schools went from about 3.7 teachers for every 100 students to 6.5, or about a 76 percent increase. That dropped just slightly—to 6.3 teachers per 100 students—in 2012.
Teaching staff grew notably over the decades, but non-teaching staff growth has been far more remarkable. Going back to 1949–50, administrative staff per pupil has more than doubled, though still with only one administrator per 325 students. Support staff has grown more than three times larger, from 1 staffer per every 81 kids to about 1 per 26 students. Principals and assistant principals have more than doubled per-pupil.
Even with massive increases in resources, we haven’t seen inflation-adjusted teacher salaries increase all that much. Since 69–70—the farthest back federal data go—salaries have only risen about 6.4 percent. Total per-pupil expenditures, in contrast, grew by around 130 percent. What gives?
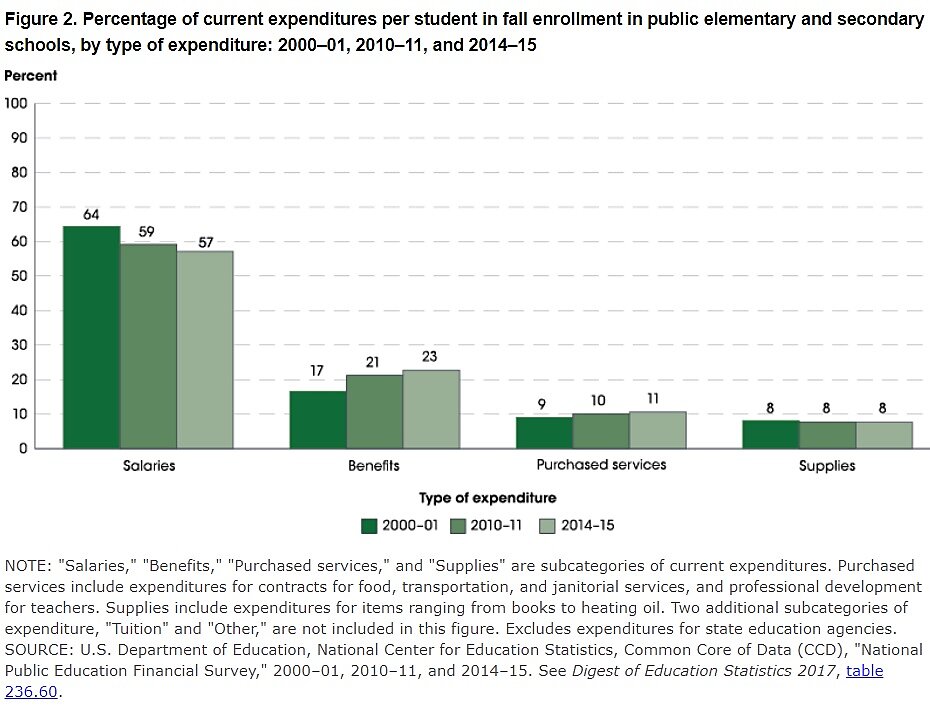
All that hiring, especially of non-teachers, for one thing. We’ve hired more teachers relative to enrollment, while teachers as a share of all public schooling staff dropped from over 70 percent in 1949–50 to just below 50 percent in fall 2015. Overall, in 1949–50 there were 19.3 students per staff member of all types—teachers, administrators, guidance counselors. In 2015 there were only 7.9. That’s a lot more salaries over which to spread money. We have also seen benefits’ share of compensation grow (see below). In 00–01 benefits accounted for 17 percent of total, current per-pupil expenditures in public schools, and salaries 64 percent. In 14–15 benefits had moved up to 23 percent and salaries 57 percent.
Short-Term & In Some States: A Historically Rare Case of (Some) Cuts
The Great Recession precipitated real cuts, something seldom seen in public schooling since the early 20th Century. But the cuts were limited, varied greatly by state, and did not occur in all areas of spending.
Between 99–00 and 14–15—the time period for which we could put together consistent, total state-level spending—outlays per-pupil nationally rose from $11,510 to $13,119, though they dropped from a peak of $13,816 in 08–09. Various services, meanwhile, saw increasing outlays not just through the whole period, but also after the recession. This is consistent with a very long-term trend: hiring more and more non-instructional staff, perhaps to deal with ever-increasing bureaucratic demands on schools, as well as assigning to schools increasing non-academic missions. The area where we saw the most significant drop in spending was capital outlays—buying land and erecting buildings.
How about specifically in the restive states? Spending cuts were not necessarily the name of the game. Arizona—which has seen huge increases in enrollment since 1969–70—increased overall spending between 99–00 and 14–15, with a big increase between 99–00 and 07–08. But that could not keep up with enrollment; on a per-pupil basis spending dropped over the period. Colorado also saw overall spending rise, but it just barely fell short of keeping per-pupil funding equal from the beginning to the end of the period. North Carolina increased overall spending slightly, but saw a decline per-pupil. Kentucky, Oklahoma, and West Virginia, in contrast, saw both overall and per-pupil spending increase.
In terms of what’s been trimmed, some buffeted states saw significant cuts in capital outlays, but that category of spending tended to be very volatile. Generally, states seemed to largely protect or even increase instructional spending, while all saw increases in spending for various types of services, a finding consistent with the increased administrative spending and staffing we have seen nationally. All except Kentucky and Oklahoma have had decreasing teacher salaries since 99–00, and every one of the hot-spot states has seen long-term stagnation in teacher salaries, which is roughly the national trend.
Conclusion
If someone tells you that public school spending has been “gutted” or “cut to the bone,” or any other body-destroying description, the first thing to note is that for many decades prior to the Great Recession we shoved so much food into the public schooling system that it would more accurately have been seen as threatened with obesity than “gutting.” Even since the recession, we haven’t typically gutted anything—significant funding has still flowed—and that includes in most embattled states. That said, at least based on salaries, teachers have seen their compensation stagnate. However, a lack of overall public schooling resources is not to blame for this. It is other things: huge increases in hiring of non-teachers, and compensation moving more toward benefits than salaries.


