With teacher strikes and demonstrations in several states tied not just to teacher compensation, but also the belief that public schooling has been starved for resources, it is worth looking at the spending data. Not trying to say what “fair” teacher pay is, or the degree to which spending may affect test scores; just seeing what we’ve been spending, and how it has changed over the years.
Let’s start with relatively recent history, the only span of years for which the federal government has readily available, total per-pupil spending data for public K‑12 schools at the state level. (These data were assembled by pulling from the version of this table for every year and adjusting for inflation.) We want to look at total spending because taxpayers don’t just spend money for operating costs such as teacher salaries, but also on things like new school buildings, expenditures only included in total cost tabulations.
Look at the colorful figure below—every state is a line—and you will see that inflation-adjusted spending generally went up, on average (the bold, black line) from $11,132 in 99–00 to $13,187 in the 2014–15 school year, an 18 percent real increase. Of course, as you can see, there are some states that spent a lot more at the outset—and boosted spending much more over time—than others.
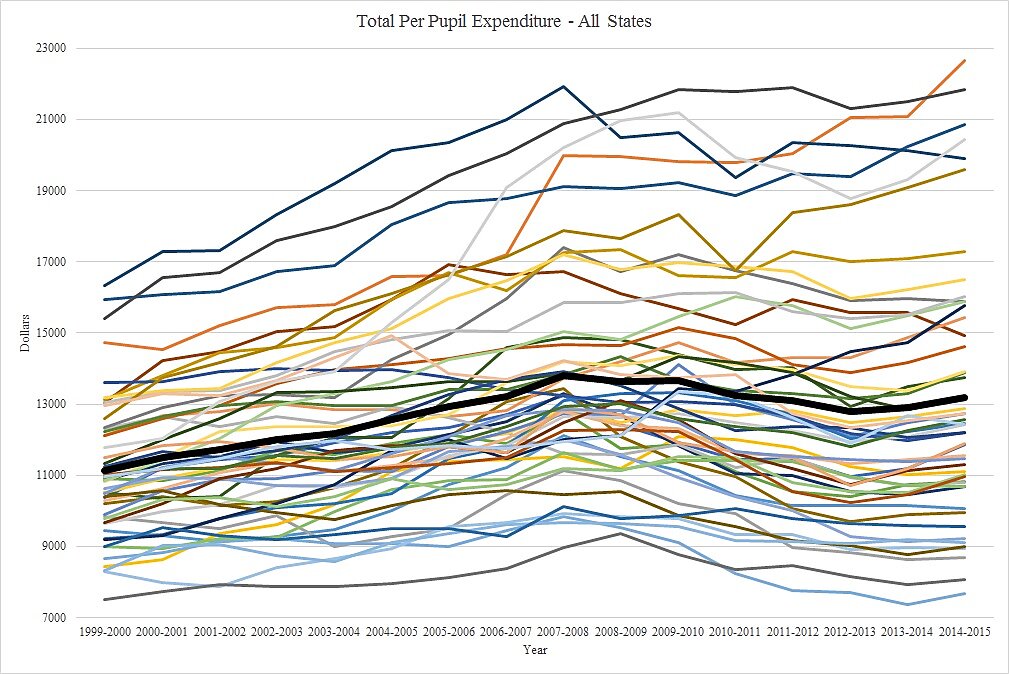
What you will also notice is a steady climb in spending between 99–00 and 07–08, a decline until 12–13, then an uptick. That’s the effect of the Great Recession and the slow recovery from it. The 12–13 trough saw an average per-pupil expenditure of $12,789, a bit more than the amount that was spent in 04–05, just 8 years earlier. As many people worried about public school resources have accurately noted, there was a drop in K‑12 spending, and on average it has not yet returned to the peak spending of 07–08. It also, however, did not take a deep dive.
Of course, we didn’t only start spending money on public schools in 99–00; we’ve spent for decades. Looking at that, as you can see below, when we say we hit a funding “peak” in 07–08, we mean peak! The drop in spending since the Great Recession has been an anomaly. Since 1919–20, inflation adjusted, total per-pupil outlays have shot up from $609 to over $13,000. (Note that “year” in the underlying data skips 10 years after 1919, and changes in 2‑year increments between 1929 and 1969.) It is a stretch to assume education funding from almost 100 years ago is comparable to today even adjusting for inflation, but just go back to 70–71; spending per-pupil has more than doubled, from $5,926 to $13,119!
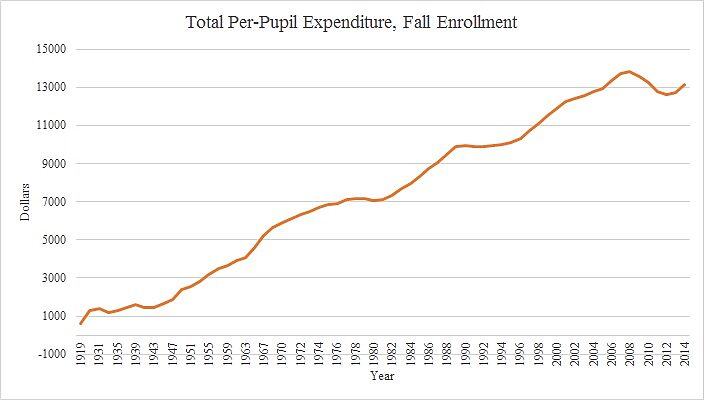
Seeing the long-term funding picture provides some crucial context that is too often neglected in discussions of public K‑12 funding broadly: It had escalated for decades, and only for a few years did it drop.
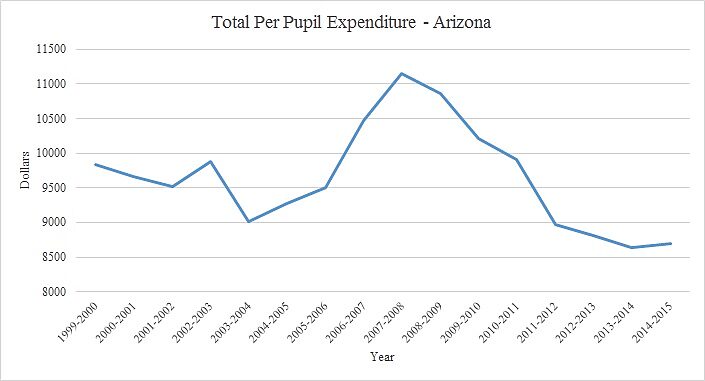
That said, let’s look at total spending since 99–00 in the states that have seen the most-discussed labor unrest—Arizona, Colorado, Kentucky, Oklahoma, and West Virginia. All are on the lower-end of spending. But have they been cutting?
In Arizona, spending has been a bit all over the map since 99–00, but was at a low point in 13–14, with just a slight uptick the following year.
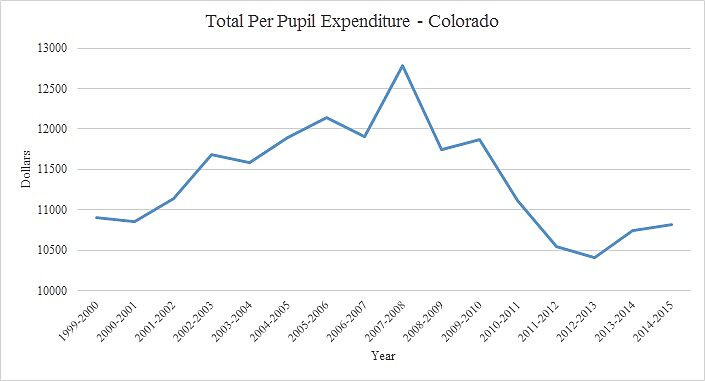
Colorado, perhaps appropriately, looks more like a mountain than Arizona, with big spending growth until 07–08, followed by a big drop. By the end of the period the state was basically right back where it began, spending $10,900 in 99–00, and $10,815 in 14–15.
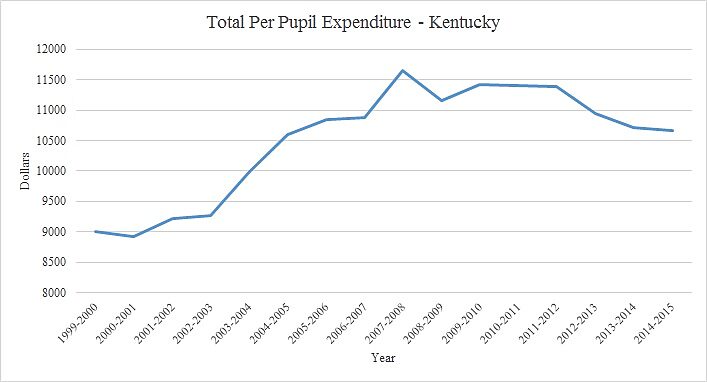
How about Kentucky? Not as striking a trend as Arizona or Colorado, with spending increasing almost 30 percent over just 8 years, and only dropping a relatively small amount afterwards, giving back around $1,000 after a more than $2,600 boost.
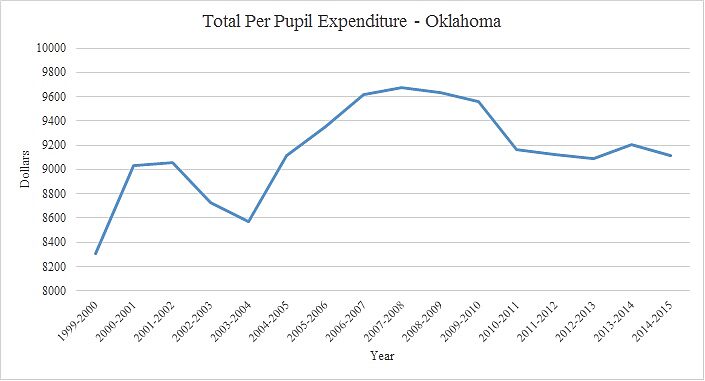
Next we go to Oklahoma, site of a long teacher labor action that started with a bang and ended with a bit of whimper…and a promise of a $6,000 boost in salary for every teacher. In the Sooner State we see a bit of a roller coaster, but since 1999–00 spending is up from $8,310 to $9,114. Of course that is down from a peak of $9,675 in 07–08, but the general trend has clearly been a rising one.
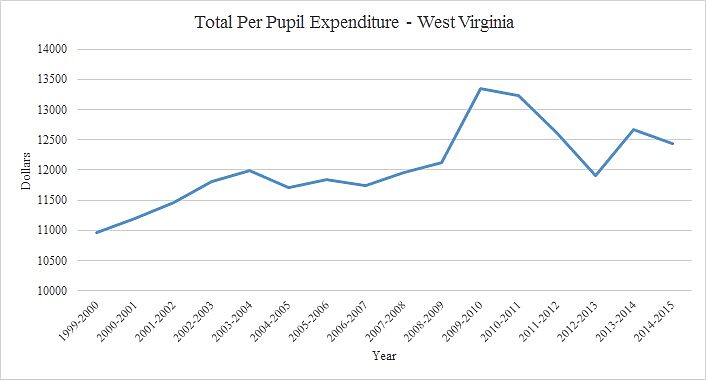
Finally, there’s West Virginia, the state that started the recent wave of demonstrations. Here again, the trend since 1999–00 is not one of cuts, but spending increases, with a zenith actually in 09–10, rather than 07–08. Indeed, in the decade between 99–00 and 09–10 per-pupil spending in West Virginia rose 22 percent, or by nearly $2,400. Yes, it generally dropped thereafter, but only down to about $12,000 in 12–13, and it had rebounded to $12,437 by 14–15.
Bottom line: Many states have seen decreasing per-pupil expenditures for public schools since the Great Recession. But how deep varies from state to state, and it comes on the heels of nearly a century of almost unremitting spending growth.
