Florida state Senator Joe Gruters (R‑Sarasota) introduced a bill (SB 168) earlier this year to ban so-called sanctuary jurisdictions in Florida and require local governments to cooperate fully with Immigration and Customs Enforcement (ICE). A sanctuary jurisdiction is any state or local government that has a policy to comply with fewer than 100 percent of ICE detainers, which are ICE requests for the local government to release an arrested or imprisoned person into ICE custody for deportation. Local and state governments still prosecute illegal immigrants for crimes in sanctuary jurisdictions, but they only turn some illegal immigrants over to ICE and uniformly if they are charged with or convicted of serious crimes.
The complaint over sanctuary jurisdictions is that they result in increased crime, but the limited research on the topic finds no increase in crime in sanctuary jurisdictions relative to non-sanctuary jurisdictions. Regardless, the methods employed in that paper, the potential for sample selection bias, and the poor quality of national crime data have impeded research into how sanctuary jurisdictions impact crime.
Regardless, we decided to do our best in looking at how sanctuary jurisdiction policies affect crime in Florida. According to the Center for Immigration Studies, Clay and Alachua counties in Florida will not honor ICE detainers without a judicial order or a criminal warrant and their policies were enacted in December 2014 and September 2015, respectively.
To compare whether the adoption of anti-detainer sanctuary policies had an impact on crime in Alachua and Clay Counties, we draw on crime data from the FBI’s Uniform Crime Reports (UCR) Return A file. The Return A is the gold standard in crime data in the economics and criminal justice literature. Since these data are provided at the reporting agency level, we aggregate the crime counts up to the county-year level to reflect the extent of geographic coverage for each anti-detainer policy. As a basis for comparison, we identify counties neighboring Alachua and Clay as counterfactual counties using the county adjacency file from the National Bureau for Economic Research. We then compute county crime rates per 100,000 to compare crime rates across counties. For illustrative purposes, we compute an “adjacent counties” counterfactual crime rate as the sum of all crimes in surrounding counties normalized by their combined population.
Figure 1 shows that the crime rates in Clay and Alachua counties have fallen just like in their neighboring counties, except for Baker County, from 2010 through 2017. If sanctuary policies in Clay and Alachua counties affected crime rates, there is no obvious indication of that in Figure 1.
Figure 1
Change in Crime Rates in Sanctuary Counties and Neighboring Counties
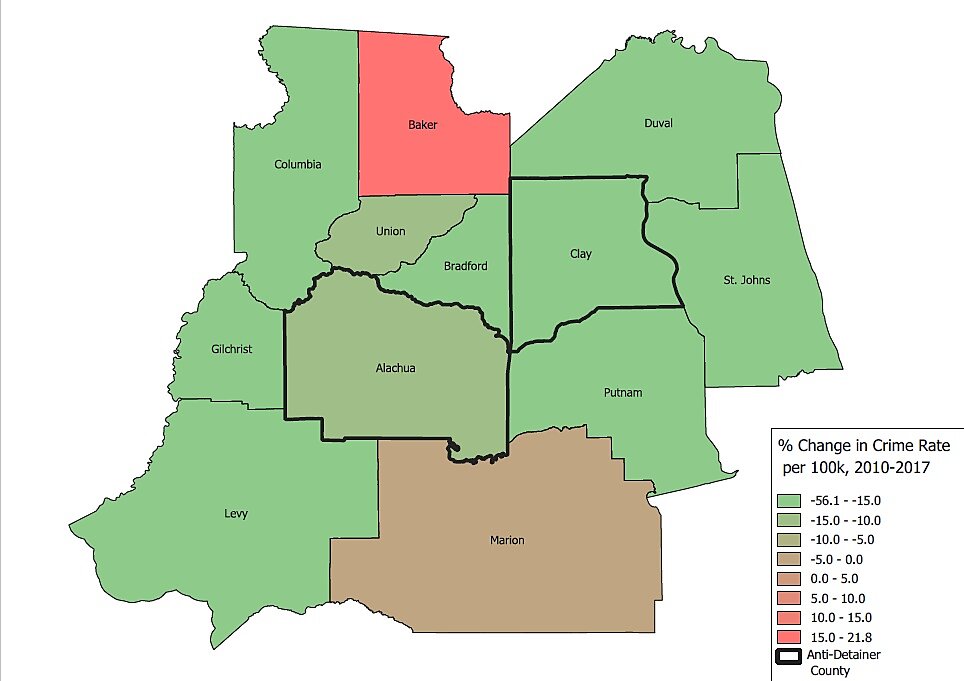
Sources: FBI, Census Bureau TIGER/Line, and Center for Immigration Studies.
Figure 2 displays the crime rates in Alachua County relative to its neighboring counties before after the sanctuary policy was enacted. The crime rates were roughly parallel before the enactment of the sanctuary policy and stayed parallel afterward, meaning that the change in policy likely had no effect on crime rates. The results look nearly identical if trends in property or violent crime rates are compared separately.
Figure 2
Alachua and Neighboring Counties Crime Rates
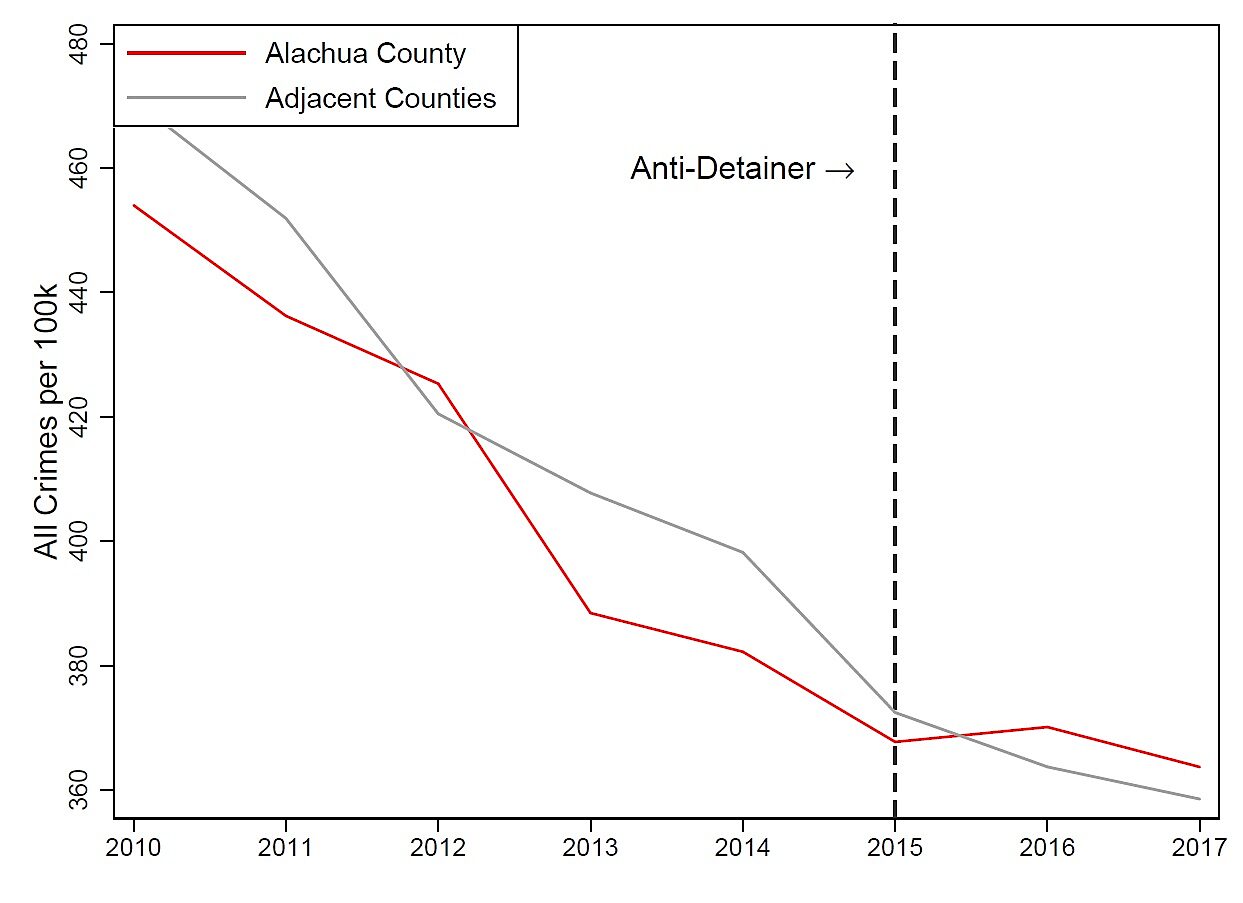
Sources: FBI and Center for Immigration Studies.
Figure 3 displays the crime rates in Clay County relative to neighboring counties. The crime rates were roughly parallel before Clay County enacted its sanctuary policy and remained roughly parallel afterward. Again, it looks as if the enactment of a sanctuary policy in Clay County had no effect on crime. More time after the enactment of the sanctuary policies and more rigorous statistical methods are required to fully analyze these effects for both Clay and Alachua Counties, but Figures 2 and 3 are convincing on their own. The results look nearly identical if trends in property or violent crime rates are compared separately.
Figure 3
Clay and Neighboring Counties Crime Rates
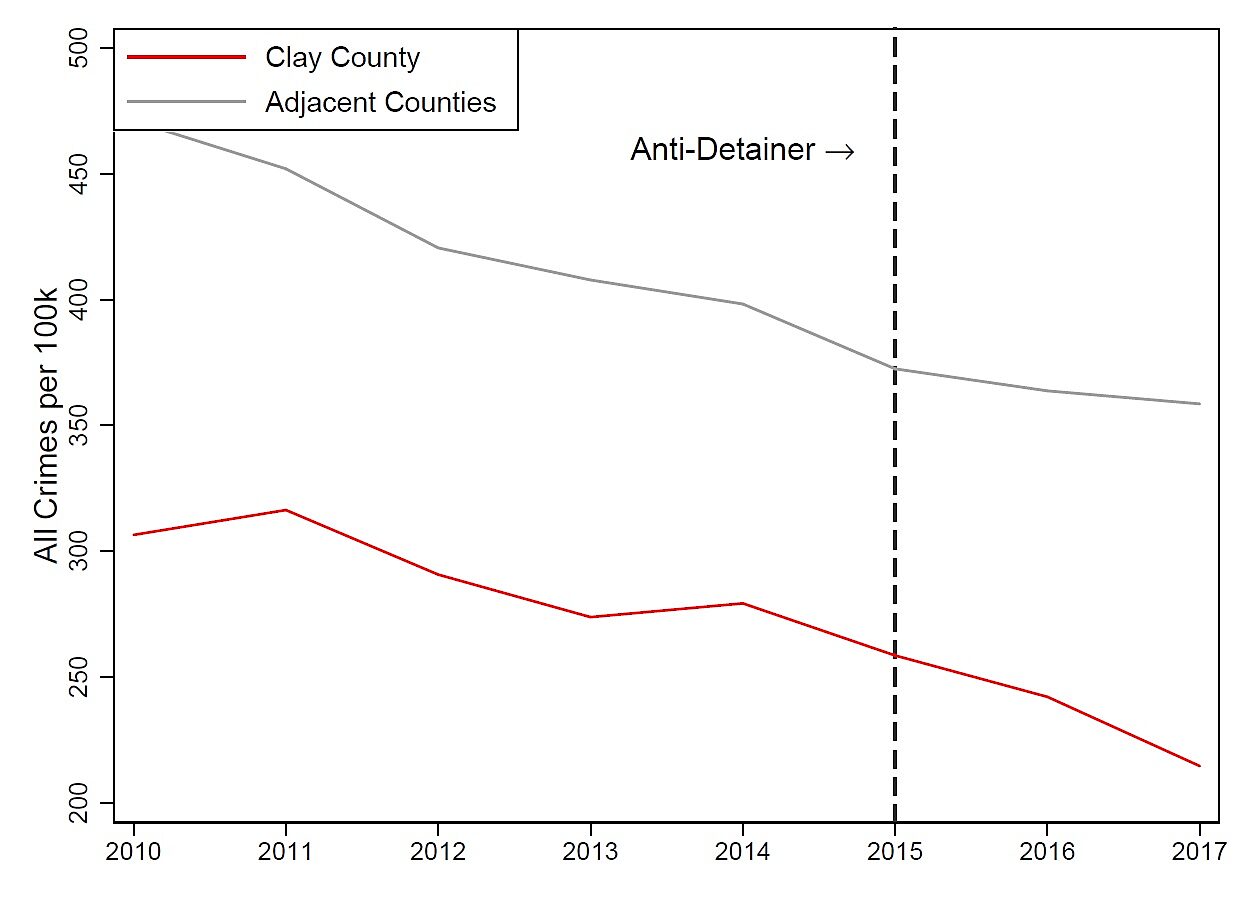
Sources: FBI and Center for Immigration Studies.
The small numbers of non-citizens in Alachua and Clay counties could explain why there was no effect on crime. In 2017, only 5.2 percent of Alachua County’s population were non-citizens and 2.5 percent of Clay County’s population were non-citizens. In different jurisdictions like Miami-Dade County, where 23.3 percent of the population were non-citizens in 2017, the effect of sanctuary city policies might be different although there is no evidence of that during the brief period when it had a sanctuary policy.
SB 168 was originally paired with a bill that would have mandated E‑Verify on the state level. E‑Verify is a government electronic eligibility for employment verification system where employers run the identity information of new hires against government databases to see if they are legally able to work. The goal of E‑Verify is to exclude illegal immigrants from the workforce. E‑Verify doesn’t work well, but it looks to have increased crime in Arizona when that state government mandated it for all new hire. Although SB 168 will have no effect on crime in Florida, at least the legislature ditched its effort to mandate E‑Verify as that may well have increased crime.
Florida currently has only two sanctuary jurisdictions according to the Center for Immigration Studies and is unlikely to have many more in coming years. Furthermore, crime rates in those counties did not rise relative to neighboring counties after they adopted their sanctuary policies. The effect of sanctuary policies on local crime rates is a subject screaming for more research, but the evidence so far shows that sanctuary policies don’t affect crime in Florida.
