Mark Hulbert’s latest Wall Street Journal column criticizes
the so-called Fed Model, which holds that P/E ratios should rise as interest rates decline, and vice versa. The strategy got its name in 1997, following a reference in a Federal Reserve report to the tendency of the S&P 500’s earnings yield—the inverse of its P/E ratio—to rise and fall with long-term interest rates. During the 15 years before the Fed made that observation, the U.S. stock market’s P/E ratio did indeed tend to be higher when interest rates were low, and vice versa, Mr. [Javier] Estrada concedes. But, he points out, that relationship hasn’t held up as well since then, raising the possibility that the apparent correlation might have been just a coincidence. Further doubts came when Mr. Estrada analyzed U.S. experience over the 100 years before 1980.
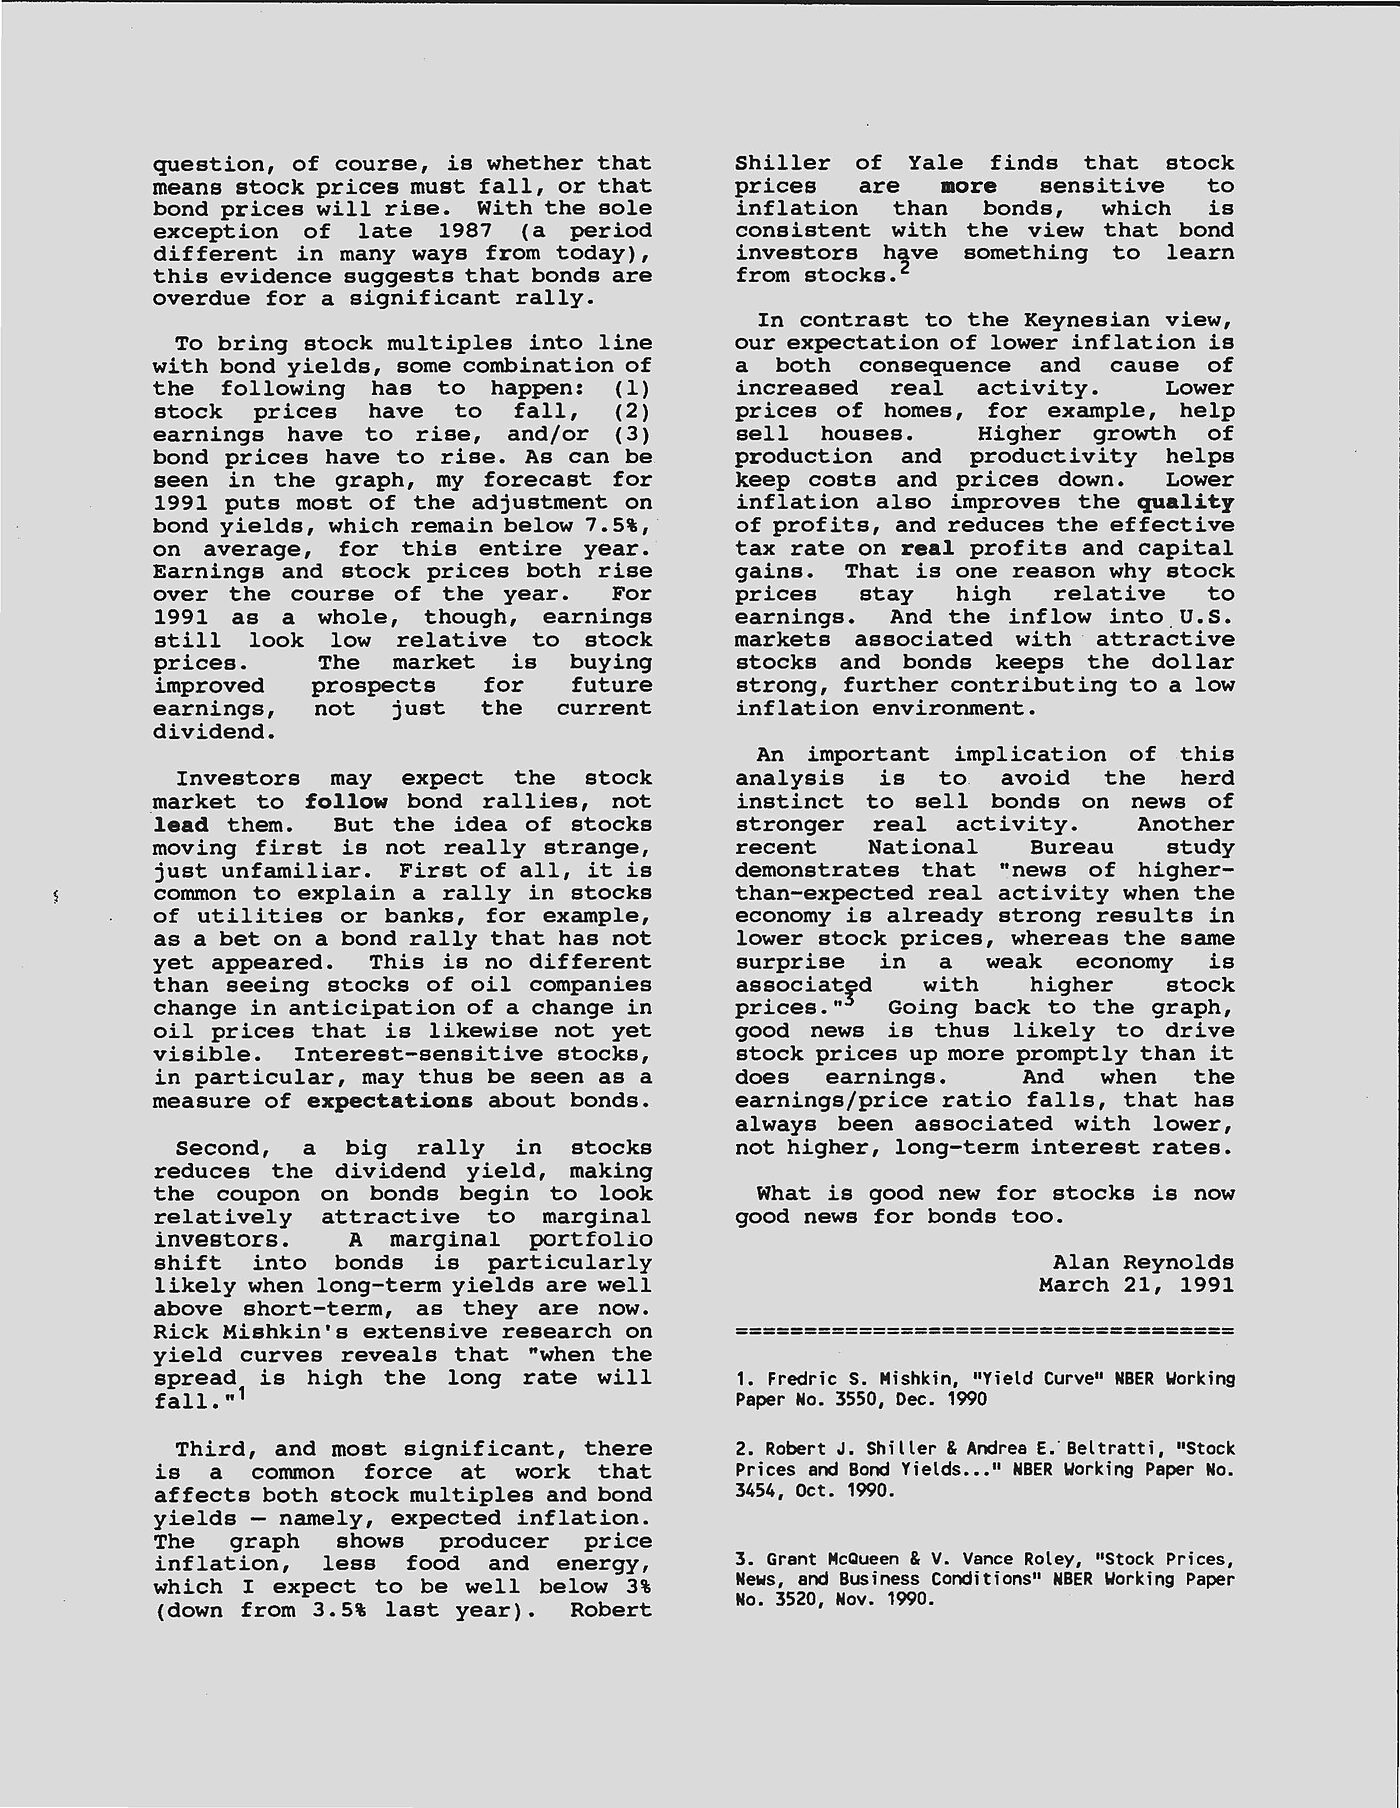
I may have discovered “the Fed Model” in March 1991– long before Ed Yardeni gave it that name after July 22,1997. The relationship between the inverted P/E ratio and bond yields was first depicted in the letter below to consulting clients (institutional investors), where I probably should have labeled it the “Reynolds Model.”
I agree with Estrada that it did not work very well before August 15, 1971, when the last remnants of the gold standards were abandoned. The gold standard did not permit the extreme gyrations in bond yields we have seen between Fed Chairmen Volcker and Bernanke. Relatively steady bond yields of 2–5 percent from 1789 to 1970 under a gold standard obviously tell us little about stock market booms and busts at that time. Contrary to Hulbert and Estrada, however, the U.S. relationship between the e‑p ratio and the 10 year bond yield remained remarkably tight from 1970 to 2008. From 1988 to 2008, the e‑p ratio averaged 4.9 and the 10-year bond averaged 6 percent.
For reasons I recently discussed in Barron’s, the Reynolds Model also failed during recent years of “quantitative easing,” when the Fed began massive purchases of government bonds. Today, the e‑p ratio is slightly higher than the 1988–2008 average (5.4), which means the p‑e ratio is lower, even though the 10-year bond is only half the recent norm. What the Reynolds Model tells us is the e‑p ratio is not low, and the p‑e ratio is likewise not high, unless the interest rate on 10-year bonds rises to at least 5 percent (which seems unlikely so long as nominal GDP keeps growing more slowly than that).
Stock prices have risen because of rising earnings, not because of a high multiple of stock prices to earnings. Any downside risks are far more likely to come from shocks to earnings (such as another oil price spike) rather than some spontaneous decline in multiples.


