Over the next couple of days, as the Nor’easter honing in on the New England coast matures and eventually unleashes its winter storm fury, you are going to be subject to a lot of global warming hype.
After all, the climate change alarmist credo is: let no extreme weather event pass without pointing out that it is “consistent with” climate change caused by human industrial society.
But this time around, the pushback is also well-prepared.
While the “curator” of the Washington Post’s newly-minted online “Energy and Environment” section Chris Mooney tells us in his article that global warming may make blizzards worse by increasing the temperature of the western Atlantic ocean and thereby increasing the moisture feed into the developing storm, meteorologist Ryan Maue is quick to point out that just the opposite is likely the result—that the elevated sea surface temperatures actually act to make such storms tamer.
Maue goes on to add that it is “easy to make case that global warming weakened this blizzard significantly due to warmer [sea surface temperatures].”
While Ryan is probably being a bit optimistic here, the reality is that this blizzard (in fact pretty much all storm events) are the result of a very complex system of physical interactions—the precise behavior of each one of which is not completely understood, much less perfectly predictable. This makes ascertaining the influence of human-caused climate change virtually (if not entirely) impossible.
Blizzards affecting New York City are perfect examples of this.
A couple years back, during another New York City blizzard, we looked at some of the confounding factors at play in determining how much it snows in Central Park. Our conclusion after reviewing the cases for both more and less snowfall there?
Which leaves natural variability as the primary driver of just how white New York City’s winters are.
Figure 1 will give you some idea of what we were talking about. It shows the winter snowfall history from New York’s Central Park since the late 1800s.
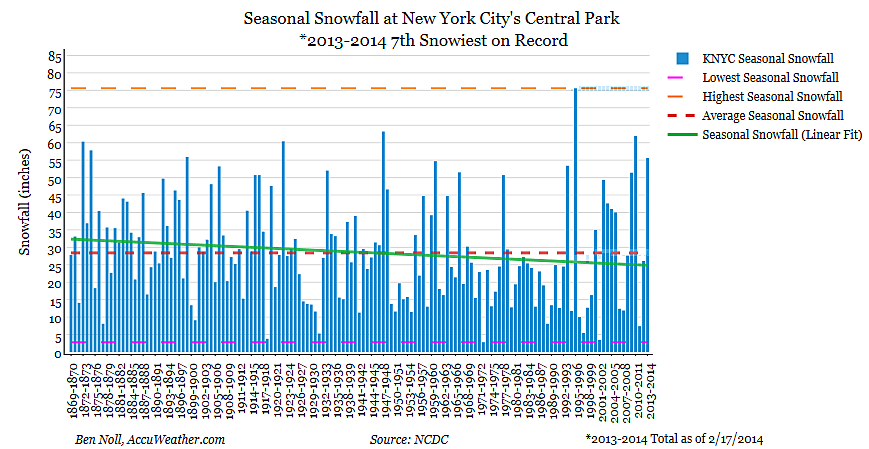
Figure 1. Winter snowfall totals from New York City’s Central Park.
Kudos to you if you can pick out the patterns formed by global warming. And if you can, please write them up for scientific publication somewhere. The world awaits the definitive answer.
In the meantime, don’t belive the hype.
