There’s no agreement on the most important variable for state tax competitiveness.
- You could make a strong case that it is the overall share of income taken by politicians in the state.
- Or you could argue that the tax system for employers is the key metric.
- And the top tax rate obviously is an important measure of a state’s economic attractiveness.
I’m sympathetic to the final option, in part because of my disdain for the income tax. And if an income tax is imposed, I prefer a simple and fair flat tax.
With that in mind, here’s a fascinating infographic I received via email. I don’t know if Reboot Illinois is left wing, right wing, or apolitical, but they did a very good job. I particularly like the map showing zero-income tax states (gray), flat tax states (red), and states with so-called progressive tax schemes (blue).
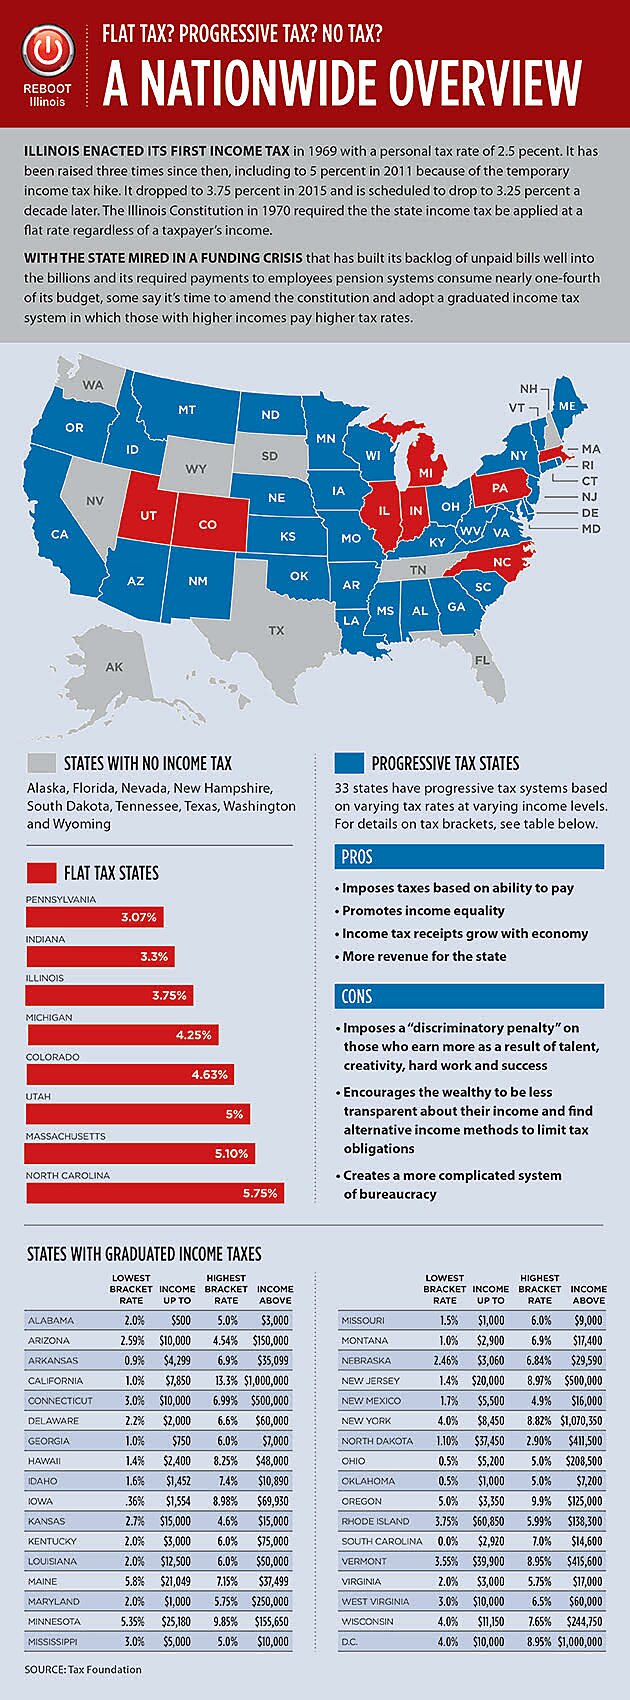
For what it’s worth, Illinois taxpayers should fight as hard as possible to preserve the state’s flat tax. If the politicians get the power to discriminate among income classes, it will just be a matter of time before all taxpayers are hit by higher rates.
Now let’s shift to the spending side of the fiscal ledger.
Like any good libertarian, I generally focus on the size of government. I compare France with Hong Kong and that tells me that big is bad and small is good.
But regardless of whether a government is large or small, it’s desirable if it spends money efficiently and generates some benefit. I shared, for instance, a fascinating study on “public sector efficiency” from the European Central Bank and was not surprised to see that nations with smaller public sectors got much more bang for the buck (with Singapore easily winning the prize for the most efficient government).
So I was very interested to see that WalletHub put together a report showing each state’s “return on investment” based on how effectively it uses tax monies to achieve desirable outcomes for education, health, safety, economy, and infrastructure, and pollution.
I’m not completely comfortable with the methodology (is it a state government’s fault if the population is more obese and therefore less healthy, for instance, and what about adjusting for demographic factors such as age and race?), but I nonetheless think the study is both useful and interesting.
Here are the best and worst states.

One thing that should stand out is that the best states are dominated by zero-income tax states and flat tax states.
The worst states, by contrast, tend to have punitive tax systems (Alaska is a bit of an outlier because it collects — and squanders — a lot of revenue from oil).
P.S. WalletHub put together some fascinating data on which cities get a good return on investment (i.e., bang for the back) for spending on police and education.
