Since 1970, the number of workers needed to operate America’s public transit systems has increased by 180 percent while the inflation-adjusted cost of operating buses, light rail, and heavy rail (the only modes whose costs are known back to 1970) increased by 195 percent. Yet ridership on those modes increased by only 32 percent.
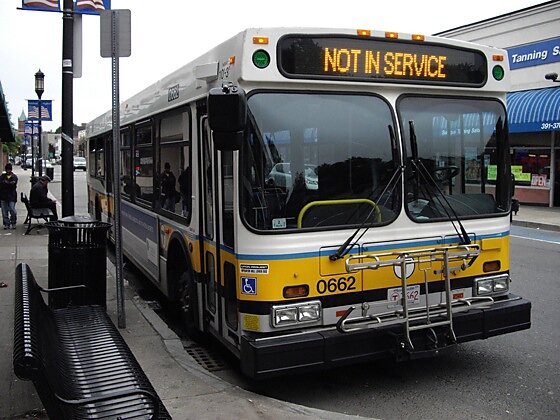
Flickr photo by Bradlee9119.
Each transit worker produced 53,115 transit trips in 1970, but only 26,314 trips by all modes in 2008. The real cost per rider grew by 124 percent, while subsidies (fares minus operating costs) grew by more than 8 times. Though capital cost data prior to 1992 are sketchy, capital costs also grew tremendously, almost certainly by more than operating costs. By any measure, then, transit productivity has declined more than 50 percent. “It’s uncommon to find such a rapid productivity decline in any industry,” noted the late University of California economist Charles Lave.
(All transit data are from the 2010 Public Transportation Fact Book, tables 1, 12, and 38. 1970 dollars adjusted for inflation using the GDP deflator.)
What accounts for this huge decline in productivity? Simple: government ownership. Prior to 1965, most transit systems were private and the industry as a whole was declining but profitable. In 1964, Congress passed the Urban Mass Transit Act, which promised federal capital grants to any government-owned transit systems. Cities and states quickly took over private transit systems, and transit agencies soon discovered that the federal government was just as willing to fund expensive transit systems as inexpensive ones, so they overbought, purchasing giant buses where small ones would do and building expensive rail lines where buses would do.
To cover their operating losses, transit agencies taxed as large an area as they could, but were then politically obligated to provide transit service to the entire taxed area. While transit’s main market is in the dense inner cities, agencies began running buses and, in many cases, building rail lines to relatively wealthy low-density suburbs that have three cars in every garage. The result of overbuying and extended service was lots of nearly empty buses and railcars: the average transit vehicle load is only about one-sixth of capacity, so if you are the sole occupant of a five-passenger SUV, you can be smugly proud that the car are driving has a higher occupancy rate than public transit.
On top of this, to be eligible for federal transit grants, Congress required transit agencies to obtain the support of local transit unions, giving unions leverage to negotiate generous pay and benefits packages. The highest-paid city employee in Madison, Wisconsin last year was a bus driver who earned nearly $160,000. The New York Times recently documented that more than 8,000 employees of the New York Metropolitan Transportation Authority (MTA) earned more than $100,000, with one collecting $239,000, last year.
Union employees reach such lofty pay levels by putting in lots of overtime. MTA even pays $34 million a year in overtime to employees who are on vacation, on the theory that if they weren’t on vacation they would probably be working overtime. When Los Angeles’ transit agency tried to save money by hiring more employees so it won’t have to pay as much overtime, union workers went on strike for 30 days and forced the agency to back down.
The American Public Transportation Association (APTA), a lobby group whose budget is several times larger than all of the highway lobby groups in DC combined, promotes increased subsidies for transit by claiming transit is better for the environment than automobiles — a claim the Cato Institute has refuted. Per passenger mile, transit and cars actually use about the same amount of energy and emit the same amount of pollution. In fact, all but a handful of transit system are far worse for the environment than cars. Moreover, cars are rapidly becoming more energy efficient, while transit has grown less energy efficient as agencies run more and more empty buses and trains into remote suburbs.
Urban transit buses are some of the most energy-intensive vehicles around because they are mostly empty. Yet private, intercity buses are some of the most energy-efficient vehicles in the country because the private operators know to run them where people want to go, and thus they average half to two-thirds full.
APTA’s other argument for transit is that it saves people money. Many transit agencies have a calculator on their web sites purporting to show how much people can save riding transit instead of driving their cars. But all these claims ignore the huge subsidies to transit.
This Cato briefing paper compared the costs of different forms of travel in 2006. Updating to 2008, auto owners spent about 22 cents a passenger mile driving, and subsidies to highways added another penny a passenger mile. Airfares averaged about 14 cents a passenger mile, and subsidies to airports added another penny. Amtrak fares averaged 30 cents a passenger mile, and subsidies brought the total to nearly 60 cents. Urban transit is about the most expensive form of travel in the United States, with fares averaging only about 21 cents a passenger mile but subsidies of 72 cents a passenger mile. This makes transit 4 times as expensive as driving.
In short, those who want to get people out of their cars and onto transit are trying to get people from an inexpensive, convenient, and increasingly energy-efficient form of travel to an expensive, inconvenient, and increasingly energy-wasteful form of travel.
The real solution for transit is privatization. Private operators would use smaller buses and would mainly serve the dense inner cities that have low rates of auto ownership. At a broader level, the transit industry offers lessons for anyone who thinks that government can do a better job at providing goods and services than the free market.

