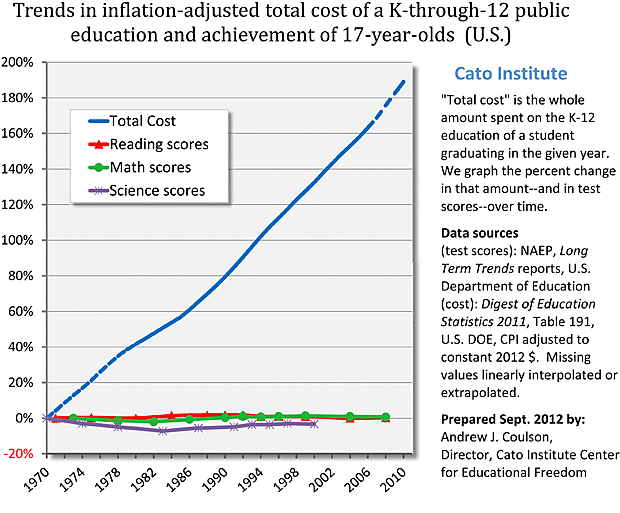
What better time than back-to-school season to revisit the trends in U.S. student achievement and public school spending? With that thought in mind, I present a newly updated version of my chart showing the total amount spent over the course of a single student’s k‑12 career, along with student achievement trends for 17-year-olds. The achievement data come from the Department of Education’s own National Assessment of Educational Progress “Long Term Trends” series, which regularly tests nationally representative samples of U.S. students, drawing from the same pool of questions in use since the tests were first administered around 1970. These are the best data we have on what our kids know by the end of high school and how much it has cost to get them there.
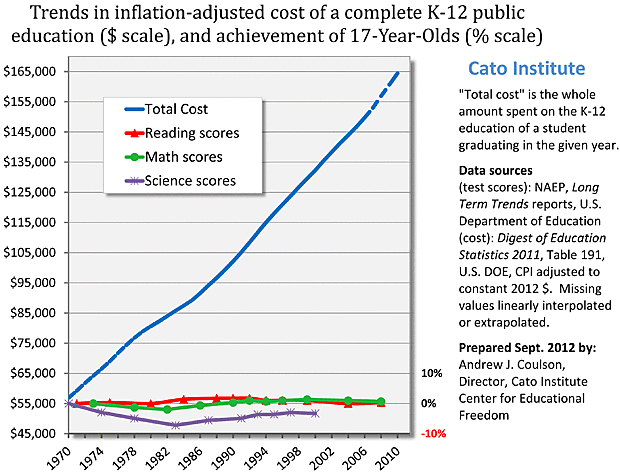
In the past, some readers have wondered if the use of two separate scales ($ on the left and % on the right) might skew the way we perceive these numbers, making the public school productivity collapse look worse than it really is. To allay that concern, I present an alternate version of the chart that places all the data on the same percentage scale. Alas, the second picture is no less bleak than the first.
If music players had suffered the same cost/performance trends we’d all still be lugging around cassette boom boxes, but they’d now cost almost $1,800.… Aren’t you glad we didn’t give tax-funded state monopolies to 19th century Victrola manufacturers?