The Wall Street Journal reports today that according to the latest Bureau of the Census figures there was a 0.4% drop in nominal U.S. public school operating spending from 2010 to 2011. The story then makes this unobjectionable factual observation:
Education officials say decreased spending will make it more difficult to prepare U.S. students for an increasingly competitive global marketplace. Some critics argue that public education costs are skyrocketing while academic achievement has not kept pace. They want the system overhauled before more money is spent.
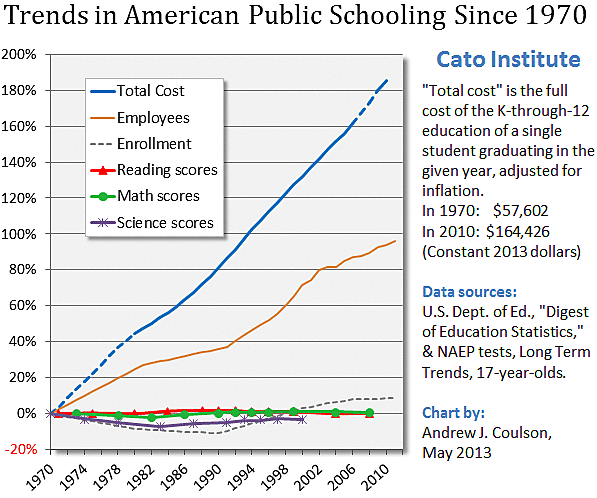
What the story does not provide readers is any measure of student achievement that would allow them to determine who is right. Let’s see if we can help out. Below is an updated version of a chart some of you will already be familiar with. It shows the performance over time of U.S. 17-year-olds on the “Long Term Trends” testing program of the National Assessment of Educational Progress. The spending line corresponds to the trend in the total cost of a complete K‑through-12 public school education (i.e., what it cost to send a high-school graduate all the way through public school). For good measure, it shows how the number of public school employees has roughly doubled since 1970–from about 3.3 to about 6.4 million people.
So, who seems to be right: “Education officials” or “some critics”?
Incidentally, the WSJ only gives the partial “operating” figures for per-pupil spending. Actual total per pupil spending in 2010, adjusted to today’s dollars, was $13,871. That was down from the all-time inflation-adjusted high of $14,090 in the previous year. Still, $346,767 per class of 25 kids doesn’t seem too shabby.

