California politics began to shift in the 1990s to such a degree that the state turned into a Democratic stronghold by the early 2000s. There are two main accounts of why that happened. The first is that Hispanics are naturally Democrats so as their numbers increased they naturally turned the state blue (Gimpel 2010 makes this point for presidential election outcomes by county) while an increasingly liberal white electorate also helped. The other theory is that Republican support for anti-immigrant ballot initiatives and candidates ruined the GOP brand in the eyes of immigrants, their children, and whites who were turned off by the nativist appeals – driving all of them into the arms of the Democrats who were pro-immigration. More evidence supports the second theory than the first.
California Partisan Background
California was never a Republican or conservative stronghold. Democrats controlled the legislature since 1959 with brief exceptions during 1969 to 1971 and from 1994 to 1996. Democratic governors were also elected in 1958, 1962, 1974, and 1978. On the policy front, California has been known for high progressive income taxes, high welfare benefit levels even after adjusting for the cost of living, and onerous building restrictions. California’s only claim to being a Republican state was that it voted for the Republican candidate in every post-World War II Presidential election prior to 1992 except for 1948 and 1964. The two presidents from California have both been Republicans – Nixon and Reagan.
Political changes in California occurred both in its elections for national positions and on the state level. This post will examine how the demographic changes, Proposition 187, other propositions that were viewed as anti-immigrant, and Republican Governor Pete Wilson’s embrace of nativism are mostly responsible for shifting the Golden State’s politics.
Proposition 187 and Pete Wilson
Known as the “Save Our State” initiative, Proposition 187 would have denied all public services to illegal immigrants and forced all state employees to immediately report illegal immigrants to the Immigration and Naturalization Service for deportation. It appeared on the ballot in 1994 when California Republican governor Pete Wilson was running a very hard fought campaign for reelection. Wilson’s campaign embraced Proposition 187, the Republican Party threw its financial support behind it and used other nativist talking points in order to win the election.
Prior to the vote, many Republican supporters of Proposition 187 admitted that its passage would not affect social service spending in California, mostly because unauthorized immigrants were already ineligible for welfare, and the rest of the package would likely be struck down by the courts. Republicans Jack Kemp and Bill Bennett even opposed Proposition 187. Their opposition was summed up by William F. Buckley Jr. thusly:
“The Kemp-Bennet position says: Look, there shouldn’t be illegal immigrants in California, but it is the business of the Federal Government to keep them away. To pass such a measure as 187 situates the GOP with a strain of xenophobia which will very quickly (California will be more than 50 percent Asian/Hispanic at the turn of the century whatever happens to illegals) evolve into anti-GOP resentments by the majority of Californians. That could lead to such electoral catastrophes as pursued many GOP candidates who were slow in boarding the civil-rights crusade.” [Emphasis added]
Bennett and Kemp were right.
Proposition 187 and Pete Wilson Were Unpopular Among Immigrant Minorities
Proposition 187 was approved by the voters in November 1994. However, the proposition was intensely unpopular among Hispanics who were the targets of the proposition (Figure 1). Michael Barone highlights an anecdote in his book The New Americans to show how off-putting Proposition 187 and Wilson’s campaign were for Hispanic Republicans like Jose Legaspi who said, “He was saying we don’t work hard.” California Republican Gregory Rodriguez said, “It was a big civics lesson. People felt they were being maligned as a group. We were being called lazy and loafers.” A Republican state senator even suggested that Hispanics in California would be required to carry identity cards. These factors galvanized the Hispanic vote against the GOP.
Figure 1
Support for Prop 187 by Race/Ethnicity
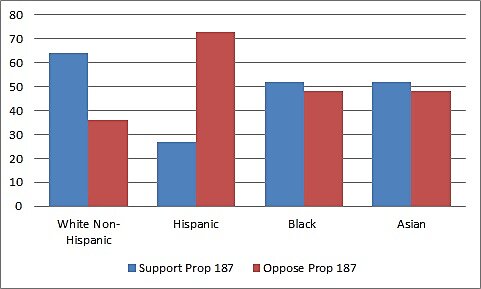
Source: Field Poll.
Governor Pete Wilson was also intensely unpopular among Hispanics and other minorities in the state. What’s different is that Wilson’s unpopularity tainted the Republican Party and has lingered for decades after the 1994 vote. A 2000 Tomas Rivera Policy Institute survey during the 2000 election revealed that 53 percent of Hispanic voters in California still associated the Republican Party with Pete Wilson. In 2010, Latino Decisions polled California Hispanics if they were concerned that Pete Wilson was the campaign co-chair for GOP gubernatorial candidate Meg Whitman — their responses were stunningly negative (Figure 2). Pete Wilson’s name was still reviled by large majorities of California Hispanics sixteen years after the 1994 campaign battle.
Figure 2
Percent of California Hispanics Who Say They Are Concerned that Pete Wilson was Meg Whitman’s Campaign Co-Chair in 2010 Election
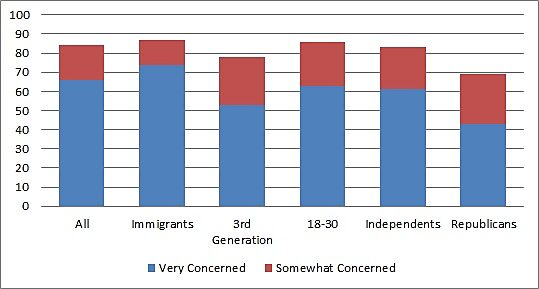
Source: Latino Decisions.
According to a recent dissertation by Abramyan (2016), Hispanics are more conservative and moderate in most of their political opinions than their overwhelming self-identification as Democrats would predict. Hispanics are more Democratic because they view that party as more supportive of liberalized immigration while the Republican Party is viewed as opposing such a policy. This means that if the GOP is to make inroads into Hispanic voters, they will need to do so by softening their stance on immigration.
Hispanic Votes for Governor: Comparing California and Texas
Pete Wilson’s 1994 unpopularity among Hispanics was new in California. Prior to that year, the California state GOP typically split the Hispanics vote with the Democrats in gubernatorial elections. In 1986, 46 percent of Hispanic voters in the state voted for the Republican governor. In 1990, 47 percent supported Pete Wilson’s election. But beginning in 1994, the Hispanic gubernatorial vote has gone heavily Democratic (Figure 3). In 1990, Wilson was relatively pro-immigration. As a Republican Senator from California, Wilson voted for the Reagan amnesty and tried, but failed, to include a large guest worker visa program in the final bill. By 1994, his pro-immigration credentials were entirely sullied.
Figure 3
Percent Distribution of Hispanic Vote in California Gubernatorial Elections
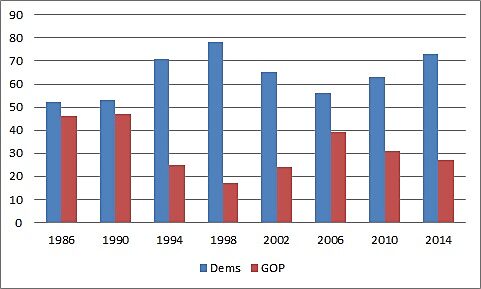
Source: Field Institute.
Texas provides an excellent counter-example to California. In 2014, Hispanics made up 38.6 percent of the population of both states. From 1980 to 2012, the non-white population of both states grew at about the same rate and are very closely correlated (correlation of 0.99). Texas’s population was 55.7 percent non-white in 2012 while California’s was 60.8 percent. The big difference between them is how their respective state GOPs treated a growing minority population.
The Texas GOP courted Hispanics and opposed Proposition 187-style laws. In 1990, Texas Republican gubernatorial candidate Clayton Williams, Jr. only earned 27 percent of the Hispanic vote compared to the California GOP’s 47 percent (Figure 4). In that year, Democrat Ann Richards was elected in Texas and Republican Pete Wilson won the election in California. In 1994, the Texas Republican candidate George W. Bush ran on a pro-immigration platform that publicly eschewed the anti-immigration politics that Wilson championed. Bush received only 28 percent of the Hispanic vote in that year but Wilson’s Hispanic vote total collapsed to only 25 percent. In 1998, George W. Bush built on the inclusive, pro-immigrant language he used in his first campaign to earn 50 percent of the Hispanic vote while California Republican Dan Lungren inherited Wilson’s legacy and only earned 17 percent – practically the reverse of 1990.
Figure 4
Hispanic Vote for Republican Gubernatorial Candidate, Texas and California
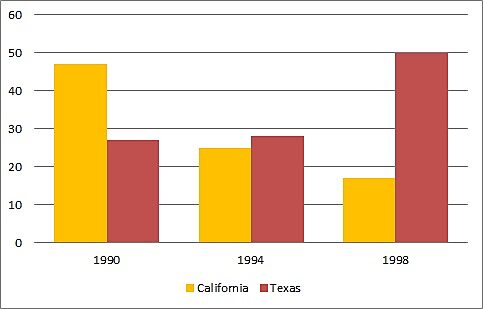
Source: Texas Tribune and Field Poll.
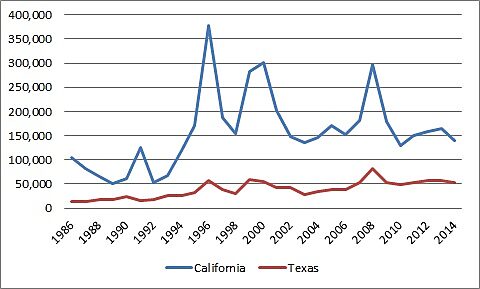
The Democratic share of the two-party vote totals in Presidential elections tells a related story (Figure 5). Despite similar demographics, Texas and California have very different Hispanic vote shares for Democrats. Texas’ dropped slightly after the mid-1990s and California’s skyrocketed.
Figure 5
Democratic Share of Two-Party Vote in Presidential Elections
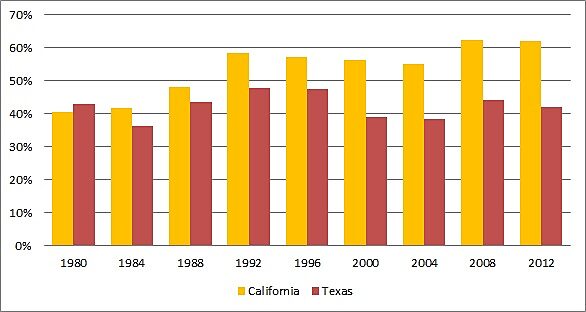
Source: U.S. Election Atlas
The Texas GOP went from alienating Hispanics in the early 1990s to splitting them with Democrats in 1998. The California GOP went from virtually splitting the Hispanic vote in 1990 to only capturing 17 percent of it in 1998. The Texas and California examples show that Hispanics can both be alienated or courted over the course of a few elections. Gimpel (2004) argues that Republican successes in Texas have much more to do with Hispanic Democrats being deactivated by a weak Democratic candidate than the GOP activating Hispanics. That may be the case but a Republican Party perceived as anti-Hispanic is a surefire way to activate Hispanic voters and keep them active.
Shifts in Partisanship: Comparing California and Texas
Monogan and Austin (forthcoming) argue that the 1994 campaigns for California Proposition 187 and Governor Wilson crashed Hispanic support for the GOP. They used a metric called macropartisanship, which is a measure of political party affiliation, to document the shift of California Hispanics away from the Republicans and toward the Democrats (Figure 6).
Figure 6
Democratic Party Identification in California as a Percent of Certain Groups
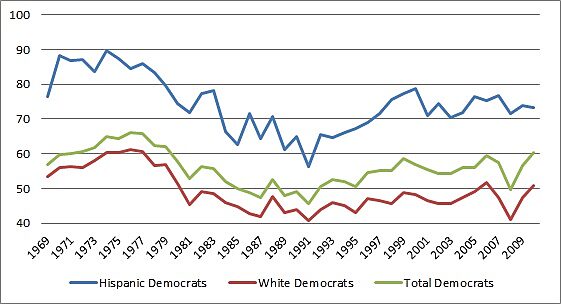
Source: Monogan and Austin (forthcoming).
Democratic Party identification hit a low point in 1991. Both Hispanics and whites had moved toward the Republicans Party and away from the Democrats in California throughout the 1980s. That trend reversed in 1991, which is also the same year that Governor Wilson began to blame unauthorized immigrants and immigration in general for California’s troubles. A 1992 special Senate election in California also emphasized that trend. Those events reversed a decade’s long trend of Hispanics becoming less Democratic (Figure 7).
Figure 7
Percentage of California Hispanics Who Identify as Democrats
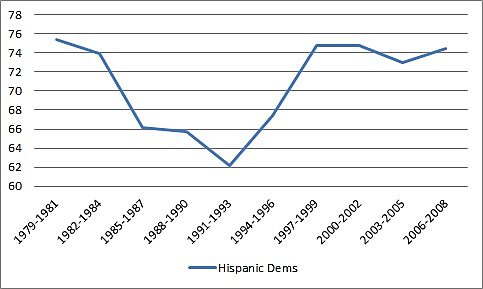
Source: Monogan and Austin.
Texas macropartisanship, by comparison, was stable throughout the time period (Monogan and Austin only have 1990–1998 data available). Democratic Party affiliation in Texas was stable (Figure 8) compared to the rise in California during the same time period (Figures 6 and 7). By 1998, California Hispanic identification with the Democratic Party was up 11 percentage points while it was down three in Texas.
Monogan and Austin estimate that the long-term effect of Proposition 187 shifted Hispanics 7.1 percentage points toward the Democrats without affecting the party identification of white voters. Overall, they estimated a 4.3 percentage point shift in the electorate in favor of the Democrats as a result of Proposition 187—more than enough to throw many elections to the Democratic Party.
Figure 8
Percentage of Texas Groups Who Identify as Democrats (1990–1998)
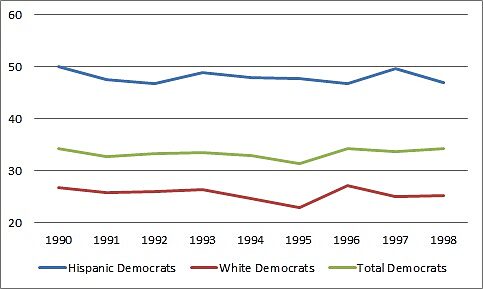
Source: Monogan and Austin.
Compared to national trends in Democratic Party identification, California and the rest of the nation moved together from 1969 to 1990 (correlation of 0.88). From 1991 to 2010, Democratic self-identification in California and the nation as a whole diverged (correlation 0.11) as California became far more Democratic than the rest of the country. Something occurred to Hispanic political party affiliations at the exact time when the California GOP was becoming more nativist.
Korey and Lascher (2006) found that California was divided into two eras of macropartisanship from 1980 to 2001. The first ran through 1991 and saw increasing Republican identification while the Democrats gained afterward. Much of that post-1991 change comes from Hispanics becoming increasingly Democratic and Democrats becoming increasingly Hispanic. One important point is that it is hard to determine if people tend to align their party identification with their ideologies or whether they align their ideologies with their party identification. The large number of conservative and moderate Hispanics who vote for the Democrats in California suggest the latter. The authors admit that they cannot determine the precise reasons for Hispanics becoming increasingly Democratic but the shift occurred at the same time the California GOP was beginning to express nativist points of view.
Dyck, Johnson, and Wasson (2011) found that Proposition 187, the other propositions, and Pete Wilson’s divisive campaign quickened Hispanic movement away from the GOP and toward the Democratic Party. There was a 20 point shift of Hispanics increasingly identifying as Republicans from 1980 to 1991 that then reversed to a 30 point Hispanic swing against the GOP from 1991 to 2001. The growth of the Hispanic population from 1980 to 2001 made that swing consequential for election outcomes. They concluded that two-thirds of the Hispanic turn away from the GOP occurred after the passage of Proposition 187. The anti-immigrant political strategy of the 1990s California GOP influenced Latino voters exodus from the GOP.
Proposition 187 Alienated Hispanics
Hispanic voters were alienated from the GOP and welcomed by the Democratic Party during the fights over Proposition 187, Wilson’s reelection, and during a series of other propositions proposed in the mid-1990s. One way this shift occurred was by galvanizing Hispanic naturalization in response to the perceived GOP threat. Increases in naturalization and the political activities of the naturalized are telling because naturalized Hispanics were less likely to participate in electoral politics and other activities with political organizations than similar native-born Hispanics were prior to Proposition 187, according to DeSipio (1996).
Pantoja, Ramirez, and Segura (2001) wanted to see whether Hispanics voted different if they naturalized because of the perceived political threat. They found that newly naturalized Hispanics in California behaved very differently from other Hispanic citizens of California and newly naturalized Hispanics in Florida or Texas. They found that voter turnout was higher for California Hispanics who naturalized in the shadow of the divisive Proposition 187 campaign than for Hispanics who naturalized at the same time in other states who were not the targets of anti-immigrant campaigns – 60 percent in the Golden States versus 37 percent in Texas.
There was an 80 percent increase in naturalization applications filed between October 1994 and January 1995 but a roughly 650 percent increase in Los Angeles County following the kickoff of the Proposition 187 campaign. From 1993 to 1996, the number of naturalizations in California rose by 554 percent. Excluding California, the nationwide increase was only 269 percent. Texas saw an even lower 219 percent increase. The nationwide, California, and Texas trends are all consistent with the threat thesis described by Pantoja, Ramirez, and Segura (2001).
California naturalization numbers surged during and after 1994 and other elections while they have been flat in Texas (Figure 9). 1993 and 1994 were watershed years in California and not in Texas. Their conclusion is: “[O]ur findings suggest that immigrant-bashing and other activities perceived to be anti-Latino potentially have huge negative political consequences for those political forces perceived to be the source of such attacks.”
Figure 9
Naturalization Petitions Filed by the Petitioner’s State of Residency
Source: Department of Homeland Security
Not only were immigrants more likely to naturalize in California as a result of Proposition 187, they were also more likely to vote. Ramakrishnan and Espenshade (2001) found that immigrants in California were twice as likely to vote as immigrants in other states without anti-immigrant ballot propositions. That trend continued for subsequent generations as well. Second generation immigrants in California were 83 percent more likely to vote than their generational peers in other states while Californians in the third and higher generations were 32 percent more likely to do so. The so-called California effect dissipated in subsequent years, possibly because anti-immigrant propositions and candidates in other states activated voters there too, but it did not fade away entirely. Proposition 187 prompted a large-scale increase in voting by the first and second generations.
Barreto (2005) found that growth of the Hispanic vote in California was driven entirely by foreign-born Hispanics of the type activated by the Proposition 187 campaign and other anti-immigrant actions. Foreign-born Hispanics were more likely to vote in California in 2002 than native-born Hispanics and about even with non-Hispanics. From 1998 to 2002, the foreign-born Hispanic vote grew by 22.1 percent while the native-born Hispanic vote actually dropped by 5 percent. These new voters broke heavily for the Democratic Party.
Focusing on voter registration and turnout in Los Angeles County, Barreto and Woods (2001) find that Hispanics in the 1998 gubernatorial election were more likely to register and vote than other groups. After 1994, Hispanic registration significantly favored the Democrats as a result of that year’s contentious election that was reinforced by later partisan disagreements over Propositions 209 and 227. Barreto, Ramirez, and Woods (2005) investigated whether the beneficiaries of the 1986 Reagan amnesty drove the bump in naturalizations in the mid-1990s. They found that amnestied immigrants did not drive that increase but a reaction to Proposition 187 and a growing number Hispanics generally explain the rise of the Hispanic vote in California from 1996 to 2000.
Citrin and Highton (2002) found that Hispanic turnout in California was always higher than in Texas but that the gulf widened in 1994 and afterward. From 1990 to 2000, the percent of the California adult population that was Hispanic jumped from 22 to 26 percent while the percent of the voting population that was Hispanic went from 9 percent to 14 percent. In 2000, there were more Hispanic adults as a percentage of the population, a greater percentage of the total registered population, and of the voter population in the state of Texas than in California. If somebody wants to argue that an increase in Hispanic voters solely explains why California became blue, they have to explain why a relatively larger voting population of Hispanics in Texas was so Republican and/or inactive.
Pantoja and Segura (2003) argue that immigrant Hispanics in California in the mid-1990s became more politically active and interested in following the candidates than Hispanics in other states because of Proposition 187. The percentages of California Hispanics who were concerned with race relations, anti-Hispanic bigotry, and other negative issues stemming from these propositions were all higher among naturalized Californians than naturalized Texans. Interestingly, this activation effect only holds for naturalized Hispanics – the group most targeted by the mid-1990s campaigns.
Political activities are not just limited to voting. Barreto and Munoz (2003) look at non-citizens attendance at political meetings, volunteering for campaigns, and their money donations to political causes. They find that foreign-born Hispanics are not less active than naturalized and native-born Americans. Contrasting slightly with the other studies, they found that non-citizens in California were not more likely to be involved in political activities than those in other states.
Proposition 187 May Have Alienated White Voters Too
Like the above papers, Bowler, Nicholson, and Segura (2006) argue that Propositions 187, 209, and 227 reversed the trend of Hispanics self-identifying as Republicans in the early 1990s and then rapidly shifted them to the Democratic camp. This paper differs from those above by finding an anti-Republican and pro-Democratic effect among non-Hispanic white Californians. In other words, California’s transformation is not just due to Hispanics being repelled by the GOP but also from non-Hispanic whites also leaving the GOP as a result of these propositions (Table 1). The small white shift matters so much because whites were a majority of the state’s electorate.
Table 1
Percentage of Whites and Hispanics in California by Political Party Identification
|
Before Propositions |
After Propositions |
|
| Hispanics | ||
|
Democrat |
38 |
63 |
|
Independent |
28 |
22 |
|
Republican |
34 |
12 |
| Non-Hispanic Whites |
|
|
|
Democrat |
30 |
37 |
|
Independent |
32 |
32 |
|
Republican |
38 |
31 |
Source: Bowler, Nicholson, and Segura.
Changes in partisanship and party identification are usually slow and gradual but the rapidity of the shift in California points to an extraordinary catalyst – like Proposition 187 affecting a group of new citizens less attached to either party. One lesson from Bowler, Nicholson, and Segura (2006) is that anti-immigrant propositions or candidates don’t just activate opposition from the groups targeted but also lose more voters in every demographic group in the long term than they gain.
Dyck, Johnson, and Wasson (2011), however, found that white voters were not turned away from the GOP as a result of Proposition 187 but that that loss in Hispanic voters was far greater than any potential gain from white, explaining the GOP’s future defeats. From 1980 to 2001, they found that the change in voting habits of non-Hispanic whites was unremarkable. Monogan and Austin (forthcoming) also found that the white vote in California did not shift as a result of Proposition 187.
Conclusion
The biggest disagreement in the research cited above is how non-Hispanic whites reacted to Proposition 187 and the GOP’s nativist turn. Bowler, Nicholson, and Segura (2006) found that whites left the GOP as a result of their nativism and perceived racial appeals that were too explicit as Mendelberg (2001) describes. In contrast, Dyck, Johnson, and Wasson (2011) and Monogan and Austin (forthcoming) find no change in white attitudes. However, they all agree that Hispanics rejected the GOP and became more Democratic in large part due to Proposition 187, Wilson, and the other GOP-supported propositions.
The thoughtful reader who still doesn’t want to credit the California GOP-fueled nativism with turning the state’s Hispanics into voting Democrats must explain why such a sudden political shift occurred at the same time as these nasty campaigns were underway. They also must explain why such a titanic shift occurred in California but not in Texas where Governor George W. Bush actually reversed the trend. The political history of the 1990s shows how easy it is to turn a group of voters against a political party when they feel targeted by it. Nuno (2007) reveals some strategies the GOP can deploy to reach out to Hispanic voters but it cannot do so while maintaining an immigration policy perceived as an anti-Hispanic.
The California Republican Party’s decision to represent the anti-immigration wing of the American electorate in the early 1990s destroyed that state’s GOP for at least a generation in exchange for winning one election in 1994 and a symbolic victory on Proposition 187 that didn’t actually change policy. That’s a bad deal that the Republican Party should avoid making again.
