Introduction
This post is about two issues that are closely related. The first are some facts and history that help explain why internal migration in post-World War II America was an important component of that economic expansion and likely to be as important in future growth. Some of this data has applications for future research into the role migration plays as a stimulus to and reaction of economic growth. The second is how studying this period of American migration could inform the academic literature on the probable effects of removing all or most of America’s immigration restrictions — an admittedly radical policy but one that should be understood.
The facts and history surrounding the post-World War II boom are somewhat controversial. Some critics of immigration argue that post World War II economic growth occurred with relatively little immigration so therefore immigration is unnecessary for economic growth today. Those critics are mistaken for many reasons, but fundamentally they misunderstand the role that national migration played in feeding economic growth during the 1950s and 1960s. Ironically, economic growth at the 1950s and 1960s rate would be exceedingly difficult or impossible to achieve without immigration.

Related Study
Deregulating Legal Immigration: A Blueprint for Agency Action
President Trump went to unprecedented lengths to restrict legal immigration in his one term—but the system was overly burdensome and expensive long before him. President-elect Joe Biden will have the opportunity to reverse these actions and deregulate this system. Here is a compendium of 30 proposals by 15 authors—including several of America’s leading immigration law experts—to help the Biden administration operate the immigration system as openly and efficiently as the law allows.
The economic growth of the 1950s and 1960s with relatively closed borders can likely not be repeated today because there are fewer underutilized Southerners, Puerto Ricans, and women who could enter the workforce as substitutes for immigrants. Growth during that time was partly fueled by the great migrations (migration is internal movement, immigration is international movement) of Americans from much poorer parts of the country, namely the South and Puerto Rico, to wealthier locations. After the government began to severely restrict low-skilled immigration in 1921, migrants from the South and Puerto Rico moved in larger numbers to fill the economic gap left by the curtailment of low-skilled immigration, some migrants moved from rural areas to urban ones, and women began to enter the workforce in greater numbers. Without the great migrations that brought tens of millions of black southerners, white southerners, and smaller numbers of Puerto Ricans to Northern and Western cities, American economic growth during those boom years would probably have been much smaller.
Furthermore, American internal migration during the 1950s and 1960s was a one-time event due to unique historical, demographic, and economic circumstances that would not repeat today if immigration were similarly restricted. Migrants and immigrants together as a percentage of the U.S. population move similarly with the average annual hours worked per worker and, thus, the labor component of production. Lawful immigration is essential to recapturing the labor force growth necessary for approaching the economic growth rates of the 1950s and 1960s.
The Great Migration
The growth of the post-war American labor force was dramatic. From 1948 to 1982, the size of the U.S. labor force grew from 60 million to 111 million. Over the same time, the number of people employed in the U.S. labor market increased from 58 million to 99 million. The Labor Force Participation Rate (LFPR) increased from 58.6 percent to 64.1 percent and the total number of hours worked per worker decreased by 9.3 percent from 898 hours a year to 814 hours a year — likely because wealthier American workers opted to “purchase” more leisure time — meaning that they can afford not to work so many hours. Here are the history and economics behind the post-World War II great migrations organized by group.
There were three large movements that helped to increase the size of the American workforce after the end of international immigration. The first was the large scale outmigration from the South. 28.6 million southerners migrated to the North during the twentieth century, 8 million blacks and about 20 million whites.
Black migration transformed a mostly rural racial group into a largely urban one within a generation. By 1980, black Americans were a majority in several cities and over 40 percent of the population in numerous others. That is an especially remarkable development because in 1940 they were no more than 13 percent of any non-southern city’s population. In 1940, 45 percent of black Southerners lived on farms while only 1 percent did so in 1980. Many blacks left the South to avoid state enforced racial segregation under brutal Jim Crow laws but higher wages elsewhere also attracted workers. The immigration restrictions of the 1920s are probably partly responsible for some of the rapid 20th century increase in the black population of Northern and Western cities. Black migration began to take off in the first two decades of the century when the U.S. had open borders with Europe and fell off during the Great Depression to be revived again by the war-time employment boom. Arguably, some of the black workers who came after the border with Europe was closed came because there was less competition in Northern and Western cities due to immigration. White migration was an even larger phenomenon — 20 million during the twentieth century — but the migration of both groups had a profound impact on American culture, politics, and economic growth. Everything from music to regional cuisines to the spread of racial politics across the country can be partly explained by the great migration of blacks and whites from the South.
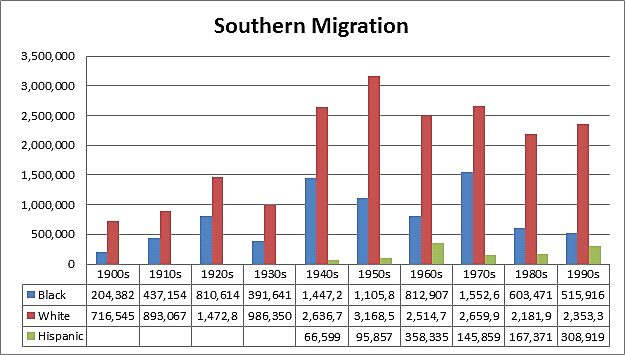
Source: The Southern Diaspora by James N. Gregory.
Of the 28.6 million who migrated, 26.4 million or 92 percent did so after the government ended free-immigration from Europe in 1921. Southern blacks as a percentage were more likely to migrate after 1921 but the percentage of white migrants was also high. At the peak of 1980, when the greatest percentage of southern born adults were living outside of the South, 34 percent of black southerners and 20 percent of white southerners were migrants. After 1980, the percentage of southern blacks and whites living outside of the south fell for four reasons.
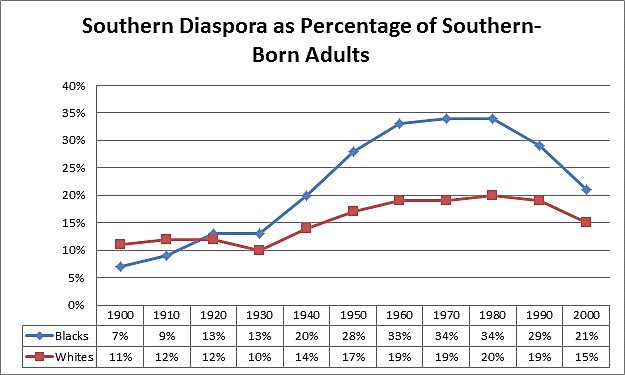
Source: The Southern Diaspora by James N. Gregory.
First, the population began to age and an aging population does not send many migrants. Between 1955 and 1970, only about 15 percent of all new migrants were over 40 years old. The most common age range for new migrants during those years was between 20 and 24. Younger people are more likely to migrate and the South was younger than the rest of the country until 1970, the year that migration as a percent of the U.S. population was at its trough and was the last time southern migrants outnumbered those earning their green cards. By 2000 the median age in the South was 35 and is surely even higher today so the quantity of people who are most likely to migrate is shrinking as a percent of the population.
|
Median Ages |
||||
|
Years |
Southern Men |
Southern Women |
South |
United States |
|
1900 |
19 |
19 |
19 |
22 |
|
1910 |
20 |
20 |
20 |
24 |
|
1920 |
21 |
21 |
21 |
25 |
|
1930 |
22 |
22 |
22 |
26 |
|
1940 |
25 |
25 |
25 |
28 |
|
1950 |
26 |
27 |
27 |
30 |
|
1960 |
25 |
28 |
27 |
29 |
|
1970 |
25 |
28 |
27 |
27 |
|
1980 |
28 |
30 |
29 |
29 |
|
1990 |
31 |
34 |
32 |
32 |
|
2000 |
34 |
36 |
35 |
35 |
Source: iPUMS.
Second, immigration of substitute workers from other countries increased. Lawful and unlawful immigration increased beginning with the economic recovery of the early 1980s and following reform of American immigration laws. The decline of Southern migrants began before the 1980s but increased immigration could be one reason why it continued to drop so much after 1980.
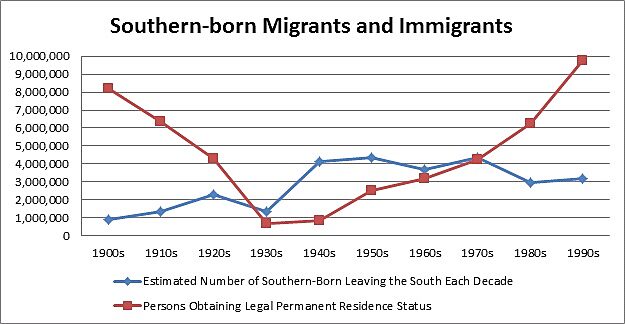
Source: U.S. Department of Homeland Security and The Southern Diaspora by James N. Gregory.
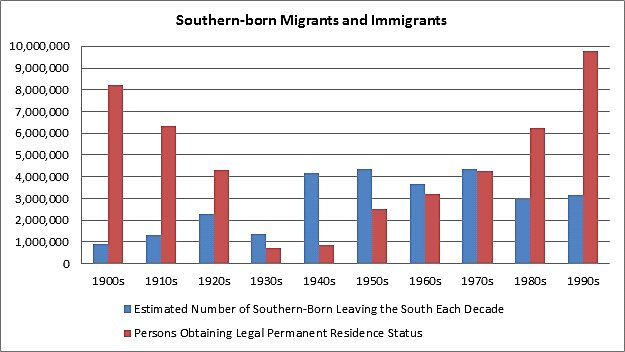
Source: U.S. Department of Homeland Security and The Southern Diaspora by James N. Gregory
Third, many of the original migrants had started to die of old age. By 1980, age cohorts from the earlier half of the twentieth century were reaching ages where they had a higher probability of dying. A 25 year old migrant who emigrated from the South in 1940 was 65 years old in 1980, for instance. This thinned the ranks of migrants.
Fourth, return migration increased sharply as a percentage of all migrants beginning in the late 1960s. The rate of economic and real wage growth increased in the South, providing a big economic incentive to return or not migrate in the first place. Interestingly, the number of blacks who returned to the South during the late 1990s was almost a third greater than those who left. The success of the civil rights movement and destruction of the Jim Crow laws also made the South more welcoming for blacks. Whites had a higher rate of return than blacks did in every time period reported except for the last two — but even their rate picked up quite after the civil rights movement succeeded.
|
Southern Return Migration |
|||||
|
Returnees |
5 Year Return Rate |
New Migrants from South |
Ratio: Returnees/Migrants |
||
| 1935–40 | Blacks |
25,673 |
1.8 |
127,015 |
0.20 |
| Whites |
176,682 |
6.4 |
595,981 |
0.30 |
|
| 1955–60 | Blacks |
78,010 |
2.7 |
361,168 |
0.22 |
| Whites |
647,786 |
10.6 |
1,194,039 |
0.54 |
|
| 1965–70 | Blacks |
114,296 |
3.7 |
336,578 |
0.34 |
| Whites |
781,687 |
11.6 |
999,363 |
0.78 |
|
| 1975–80 | Blacks |
210,800 |
5.2 |
278,600 |
0.76 |
| Whites |
897,400 |
12.2 |
915,600 |
0.98 |
|
| 1985–90 | Blacks |
229,113 |
6.3 |
241,892 |
0.95 |
| Whites |
733,902 |
10.4 |
984,267 |
0.75 |
|
| 1995–2000 | Blacks |
232,985 |
7.7 |
176,642 |
1.32 |
| Whites |
772,076 |
10.8 |
907,550 |
0.85 |
Source: The Southern Diaspora by James N. Gregory.
None of this migration can be understood without studying regional wage differences. Wages are the prices that incentivize migration and immigration. Wage gains from migration for the lower-skilled workers were almost always higher as a percentage compared to wage gains for higher skilled workers in 1949 and 1969. While wages are vitally important to understanding the great migration, uncovering much of the wage data is a research project itself. I will just post this table to indicate how large the wages gap was.
|
Mean Income for Southern-Born Black Males by Location Schooling in 1949 (Age 35–49) |
||||||
|
Migrants |
In South |
% Gain Outside South |
Migrants in Non-Southern Cities |
Living in Southern Cities |
% Gain Outside South |
|
| All |
$2,375 |
$1,415 |
67.8% |
$2,409 |
$1,776 |
35.6% |
| 0–8 grade |
$2,253 |
$1,318 |
70.9% |
$2,288 |
$1,699 |
34.7% |
| 9–12 grade |
$2,604 |
$1,858 |
40.2% |
$2,623 |
$1,913 |
37.1% |
| Some College |
$2,940 |
$2,351 |
25.1% |
$2,957 |
$2,505 |
18.0% |
|
Mean Income for Southern-Born White Males by Location Schooling in 1949 (Age 35–49) |
||||||
|
Migrants |
In South |
% Gain Outside South |
Migrants in Non-Southern Cities |
Living in Southern Cities |
% Gain Outside South |
|
| All |
$3,449 |
$2,850 |
21.0% |
$3,629 |
$3,495 |
3.8% |
| 0–8 grade |
$2,825 |
$2,156 |
31.0% |
$2,950 |
$2,716 |
8.6% |
| 9–12 grade |
$3,597 |
$3,248 |
10.7% |
$3,702 |
$3,632 |
1.9% |
| Some College |
$5,026 |
$4,705 |
6.8% |
$5,214 |
$5,077 |
2.7% |
|
Mean Income for Southern-Born Black Males by Location Schooling in 1969 (Age 35–49) |
||||||
|
Migrants |
In South |
% Gain Outside South |
Migrants in Non-Southern Cities |
Living in Southern Cities |
% Gain Outside South |
|
| All |
$7,548 |
$5,036 |
49.9% |
$7,618 |
$5,590 |
36.3% |
| 0–8 grade |
$6,681 |
$4,111 |
62.5% |
$6,765 |
$4,698 |
44.0% |
| 9–12 grade |
$7,376 |
$5,389 |
36.9% |
$7,423 |
$5,634 |
31.8% |
| Some College |
$10,206 |
$8,238 |
23.9% |
$10,290 |
$8,306 |
23.9% |
|
Mean Income for Southern-Born White Males by Location Schooling in 1969 (Age 35–49) |
||||||
|
Migrants |
In South |
% Gain Outside South |
Migrants in Non-Southern Cities |
Living in Southern Cities |
% Gain Outside South |
|
| All |
$10,950 |
$9,575 |
14.4% |
$11,427 |
$10,989 |
4.0% |
| 0–8 grade |
$8,370 |
$6,446 |
29.8% |
$8,863 |
$7,396 |
19.8% |
| 9–12 grade |
$9,926 |
$8,860 |
12.0% |
$10,196 |
$9,618 |
6.0% |
| Some College |
$15,127 |
$14,154 |
6.9% |
$15,714 |
$15,186 |
3.5% |
Source: The Southern Diaspora by James N. Gregory.
The South wasn’t the only source of migrants during this period. Millions of rural Americans moved to cities but data on this is far from reliable or complete. Education, skills, and incomes were generally lower in the South than in the rest of the United States, the South was as poor as many foreign countries that previously sent large numbers of low-skilled immigrants, and migrants from the South earned lower incomes, on average, than other Americans. Those similar characteristics make southern migrants partly substitutable for lower-skilled immigrants from abroad.
Puerto Ricans
The second phase was the movement of Puerto Ricans to the American mainland. Puerto Rico was conquered by the United States in 1898 during the Spanish American War. In 1917, all Puerto Ricans were granted American citizenship and were allowed to travel to the mainland without legal barriers. Puerto Ricans were far less skilled, educated, and were usually not proficient in English compared to southerners and other Americans. This group is the most substitutable for low-skilled immigrants from abroad and they moved to New York and other East Coast destinations in large numbers after European immigration was ended.
Prior to the Census of 1960, Puerto Ricans were defined as those who were born on the island and lived in the United States while after 1960 that category included those of Puerto Rican parentage, so I had to estimate the numbers. Since they are so small in comparison to the size of the workforce and population, my estimates could be wildly off and it won’t change my outcomes.
Women
The third movement was the large-scale entry of women into the American workforce. After World War II the number of working women rose from 16.3 million in 1948 to 43.3 in 1982 — a 165 percent increase. Female LFPR increased from 33 percent to 53 percent. During the same time, male workers went from 42 million to 56 million workers, increasing by a modest 34 percent. The male labor-force participation rate, however, declined from 87 percent to 77 percent.
Importantly, women were complements for men in the workforce because they tended to work in different professions until later in the twentieth century. Women entering the workforce could have been responsible for some of the lowering male labor force participation rates but, if men and women are complements in the labor market, their entry could have created employment opportunities for men so many of them decided to leave the workforce for other reasons.
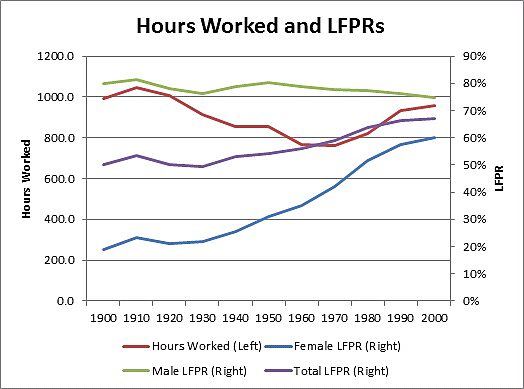
Source: Historical Statistics of the United States, 2013 Economic Report of the President, Valerie Ramey, and Brink Lindsey.
Increasing female LFPRs added to an population-wide increase in that metric. However, total LFPR often goes in the opposite direction as the average number of hours worked. That is because labor supply curves are backward bending at a point, thus workers with higher incomes chose to “purchase” more leisure time at the expense of foregone income. It’s possible that female LFPRs could increase and push total LFPR up. However, looking back at the twentieth century, it is unclear whether that would increase the total number of hours worked. Migrants and immigrants look to be more closely associated with increases in the total number of hours worked.
Importance of Labor Force Growth
Economic growth comes from a function of two sources. The first is an increase in the quantity of the factors of production like the number of laborers and capital. The second is an increase in the productivity of those factors. If the quantity of factors decreases or remains steady then their productivity has to increase to hold growth steady. If productivity decreases, then an increase in the quantity of factors can make up for it. Measuring the quantity of labor and capital is relatively straightforward but numerous methodological problems emerge when measuring productivity.
Economists try to solve those problems through a measure known as total factor productivity (TFP) or multi-factor productivity. The most famous equation that represents that is the Cobb-Douglas Production Function:
Y=Total Production.
L=Labor input, the total number of human-hours worked.
K=Capital input, the real value of all equipment, machinery, and buildings.
A=Total factor productivity, productivity that cannot be explained by changed to L and K.
α and β are the output elasticities of capital and labor, respectively. These values are constants determined by available technology.
A is the measure of productivity not caused by an increase in K or L. If K or L decreases then A must increase to make up for it or else Y will shrink. Growth of all of these factors has either slowed or actually reversed in the first decade of the twenty-first century, an unprecedented event. As my colleague Brink Lindsey pointed out, when growth in one or two factors slowed or reversed in America’s past, growth in the others increased. That offsetting increase in growth of factors or productivity has not occurred in recent years. An increasing quantity of L can make up for a decreasing A or K, thus guaranteeing an increase in Y.
Migrants and Immigrants Increase Per Capita Work Hours
Migrants likely have a higher LFPR and work more hours because of their relatively elastic labor supply curves, thus migrant share of the population could explain the change in average work hours over the course of the 20th century. As the percentage of migrants shifts as a percentage of the total population, the number of average hours worked per capita shifts in the same direction — increasing L in the equation above.
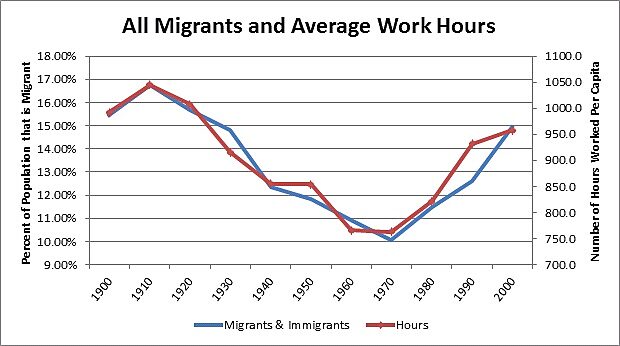
Source: Valerie Ramey, Current Population Survey, The Southern Diaspora by James N. Gregory, and U.S. Census
From 1964 to 2000 the number of hours worked per worker has increased, making up for declining TFP and capital growth during that time — meaning that economic growth was maintained in part through growth in the quantity of hours worked. Migrants and immigrants have more elastic labor supply curves as they respond to the income effect, meaning that they increased the quantity of their work hours supplied more than other Americans in response to similar wage increases. Migrants and immigrants move toward those higher wages, guaranteeing an increase in the per capita quantity of hours — making up for declining total factor productivity and capital accumulation.
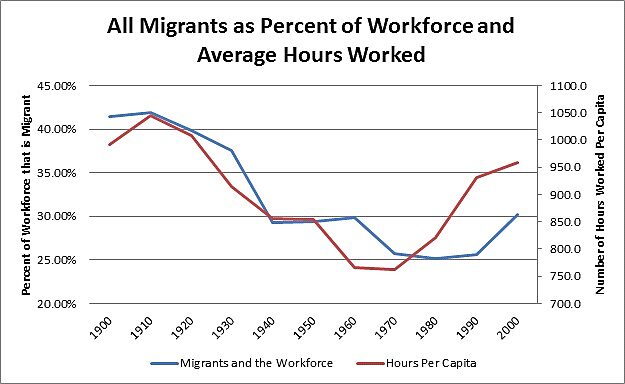
Source: Valerie Ramey, Current Population Survey, The Southern Diaspora by James N. Gregory, and U.S. Census.
Post-War America was the Exception
The mass movement of southern Americans, women, and Puerto Ricans into the workforce was a one-time boon that cannot be repeated. The potential to expand America’s workforce to fuel future economic growth is extremely limited because so many are already working and Americans are aging. The U.S. workforce was able to adapt to the end of immigration after 1921 because vast numbers of Americans were underutilized in the South, Puerto Rico, out of the labor force entirely, and young — a reserve army of labor. If such a policy were adopted today the U.S. labor force would not be able to adapt similarly. Immigrant labor is the most effective, cheapest, and possibly only realistic way to guarantee long-term increases in the size of the labor force, grow L, and increase economic growth.
Current unemployment, relatively low Labor Force Participation Rates (LFPR), and large numbers of able elderly workers will provide some labor force growth when the economy picks up but not enough to replicate or expand upon the labor force growth that occurred in the mid-twentieth century. Teenage LFPR could also increase but that would require lowering minimum wages and lowering the opportunity cost of education. It’s unlikely that teenage employment growth will somehow increase enough to make up for that shortfall.
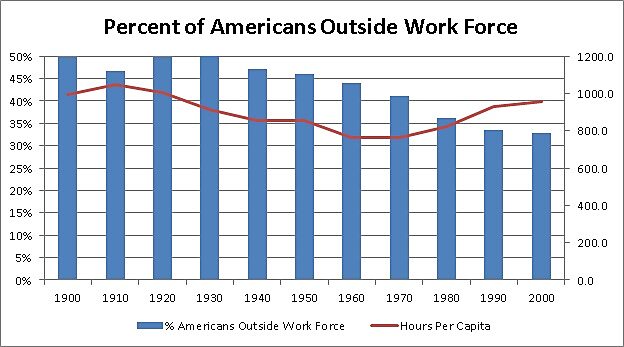
Source: Historical Statistics of the United States, 2013 Economic Report of the President
Between 1900 and 2000, the percentage of Americans not working fell from 49.8 percent to 32.9 percent — decreasing by a third the relative quantity of non-workers. 84 percent of that total increase occurred after 1950 when the great migration of southerners, women, and Puerto Ricans was in full swing.
Increasing wages due to increased labor scarcity would draw more workers out of retirement, teenagers, other Americans, and unauthorized immigrants to work in sectors of the economy. During the 1950s and 1960s the Bracero Program supplied Mexican farm workers to rural areas which made unauthorized immigration largely unnecessary. Since Bracero was cancelled in 1964, other guest worker visas for lower-skilled immigrants have not been able to meet demand, creating a black market of unauthorized immigrant workers. The percentage of Americans who could be drawn from outside of the labor force into it will likely shrink without large increases in immigration.
Whatever happens on the margin, large increases in the size of the labor force similar to that which occurred in the 1950s and 1960s will not occur again without immigration. the pool of the presently unemployed could shrink substantially, it is unlikely to fill a potential gap left by the end of immigration. In examining policy proposals to increase economic growth, policymakers should be keenly aware that migration played a critical role in the economic expansion of the 1950s and 1960s.
Applications for Academic Research
Many people cite Michael Clemens’ 2011 paper in the Journal of Economic Perspectives as evidence of the vast economic gains that would occur if there were global open borders. Clemens took a look at the leading papers that estimated the economic gains from open borders and interpreted the estimates — ranging from about a 50 percent increase in global GDP to a 150 percent increase. Big numbers.
But those big numbers depend upon many people moving from the developing world to the developed world where their wages, because of their increased productivity, are higher. The numbers of people who would have to move to boost GDP by such large amounts are so large that they are unrealistic, a point articulately made in this blog post.
Studying the quantity of migrants who moved from the South to the rest of the United States during the great migrations of the 20th century and the wage factors that incentivized their migration could help set a baseline to investigate potential immigration if the U.S. ever adopts an open-borders policy. This will require more research into regional wage variations during the great migrations but it could be a very fruitful project in trying to accurately predict the numbers of people who would immigrate if the U.S. adopted an open immigration policy.
Conclusion
The economic experience of the 1950s and 1960s — rapid economic growth with relatively closed borders — cannot be repeated today because there are fewer underutilized Southerners, Puerto Ricans, and women who could enter the workforce as substitutes for immigrants. Teenagers, some of the unemployed, and others who have dropped out of the labor force could provide some growth in the quantity of workers but nowhere near enough to substantially increase the number of hours worked and make up for relatively low growth in the other factors of production. Immigrants did not crowd out many American migrants. The substitution of southern and Puerto Rican migrants petered out sometime between 1960 and 1970, before international immigration could substitute and at a time when the percentage of immigrants was the lowest ever recorded in American history. Immigration restrictions face a trade-off between more restrictive immigration and economic growth that they should be weighing more carefully than they currently do.
Studying the great migrations can also help illuminate how many immigrants would come if radical policy alternatives like open border are ever adopted in the developed world — but more research needs to be done on historical regional wage variations.
