53% Say Ability to Immigrate Is a “Human Right,” 53% Oppose Immigrant Households Receiving Welfare
The Cato Institute 2021 Immigration and Identity National Survey, a new national survey of 2,600 U.S. adults, finds that nearly three-fourths (72%) of Americans believe immigrants come to the United States to “find jobs and improve their lives” while 27% think immigrants come to obtain government services and welfare.
READ THE FULL SURVEY REPORT HERE
Support for More Immigration Is on the Rise
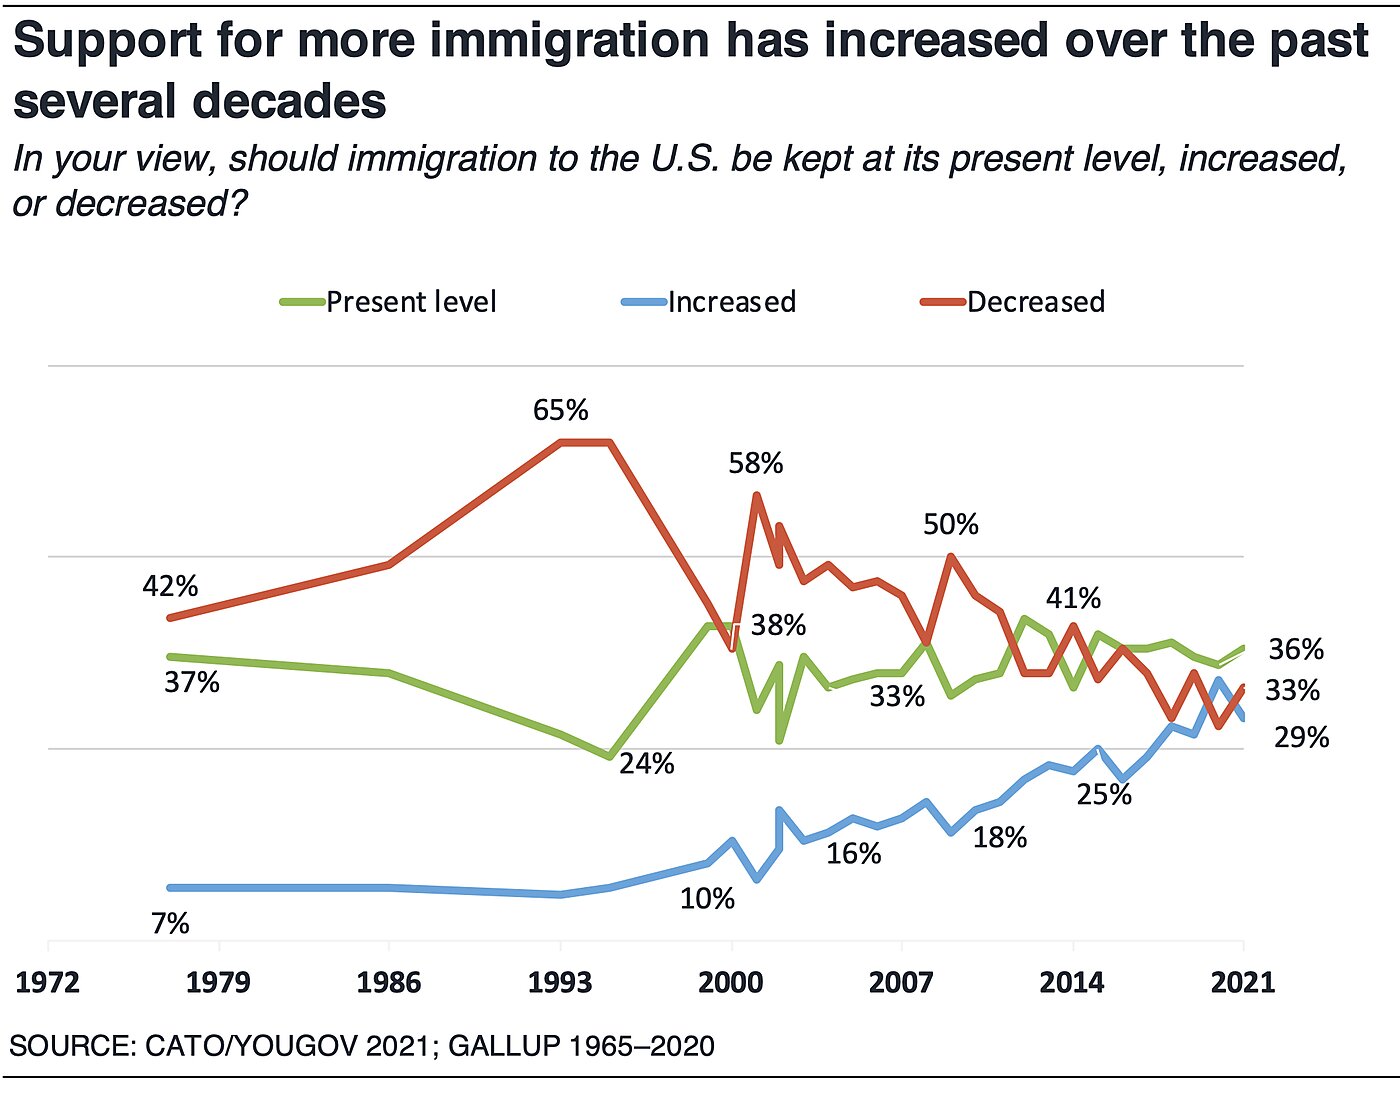
Support for more immigration has tripled from the mid-1990s when about 10% of the public supported more immigration and two-thirds wanted less. Today 29% of Americans want more, 38% want to maintain current levels, and 33% want less.
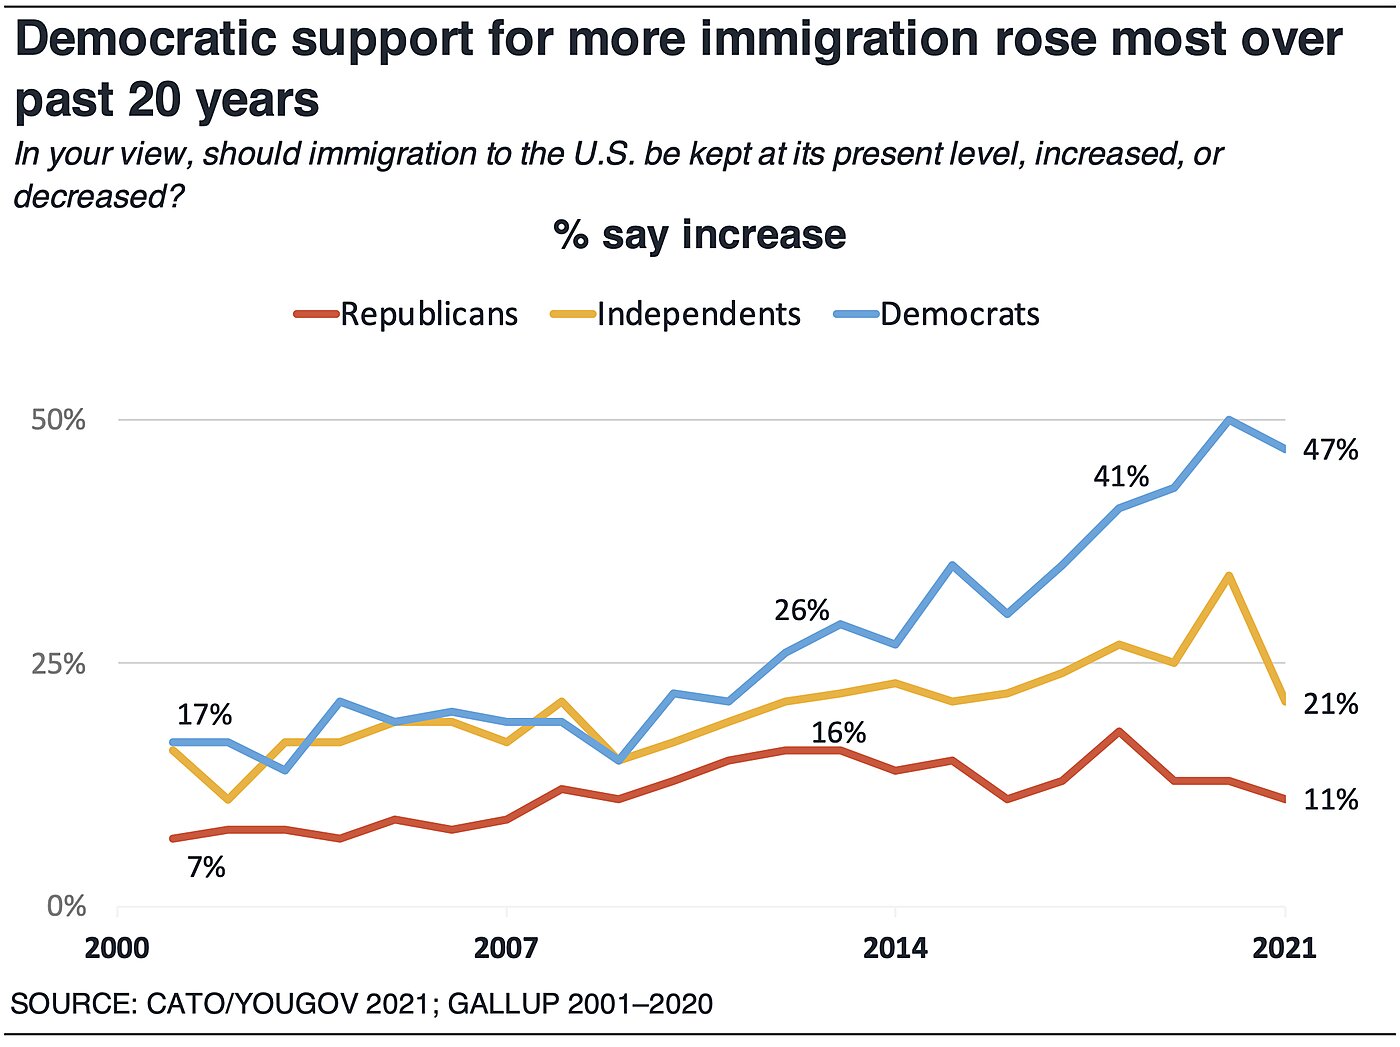
Democrats’ views largely account for this shift. Starting around 2008–2010, Democratic support for more immigration rose from about 20% to 47% today.
70% of Democrats Say Racist Beliefs Drive Desire for Less Immigration
Seventy percent (70%) of Democrats say racist beliefs drive the desire for less immigration. In contrast 57% of all Americans, as well as 60% of independents and 88% of Republicans say a sincere interest in controlling the country’s borders is the reason.
91% of Americans Welcome Immigration to the U.S., 9% Want to Shut Down the Border
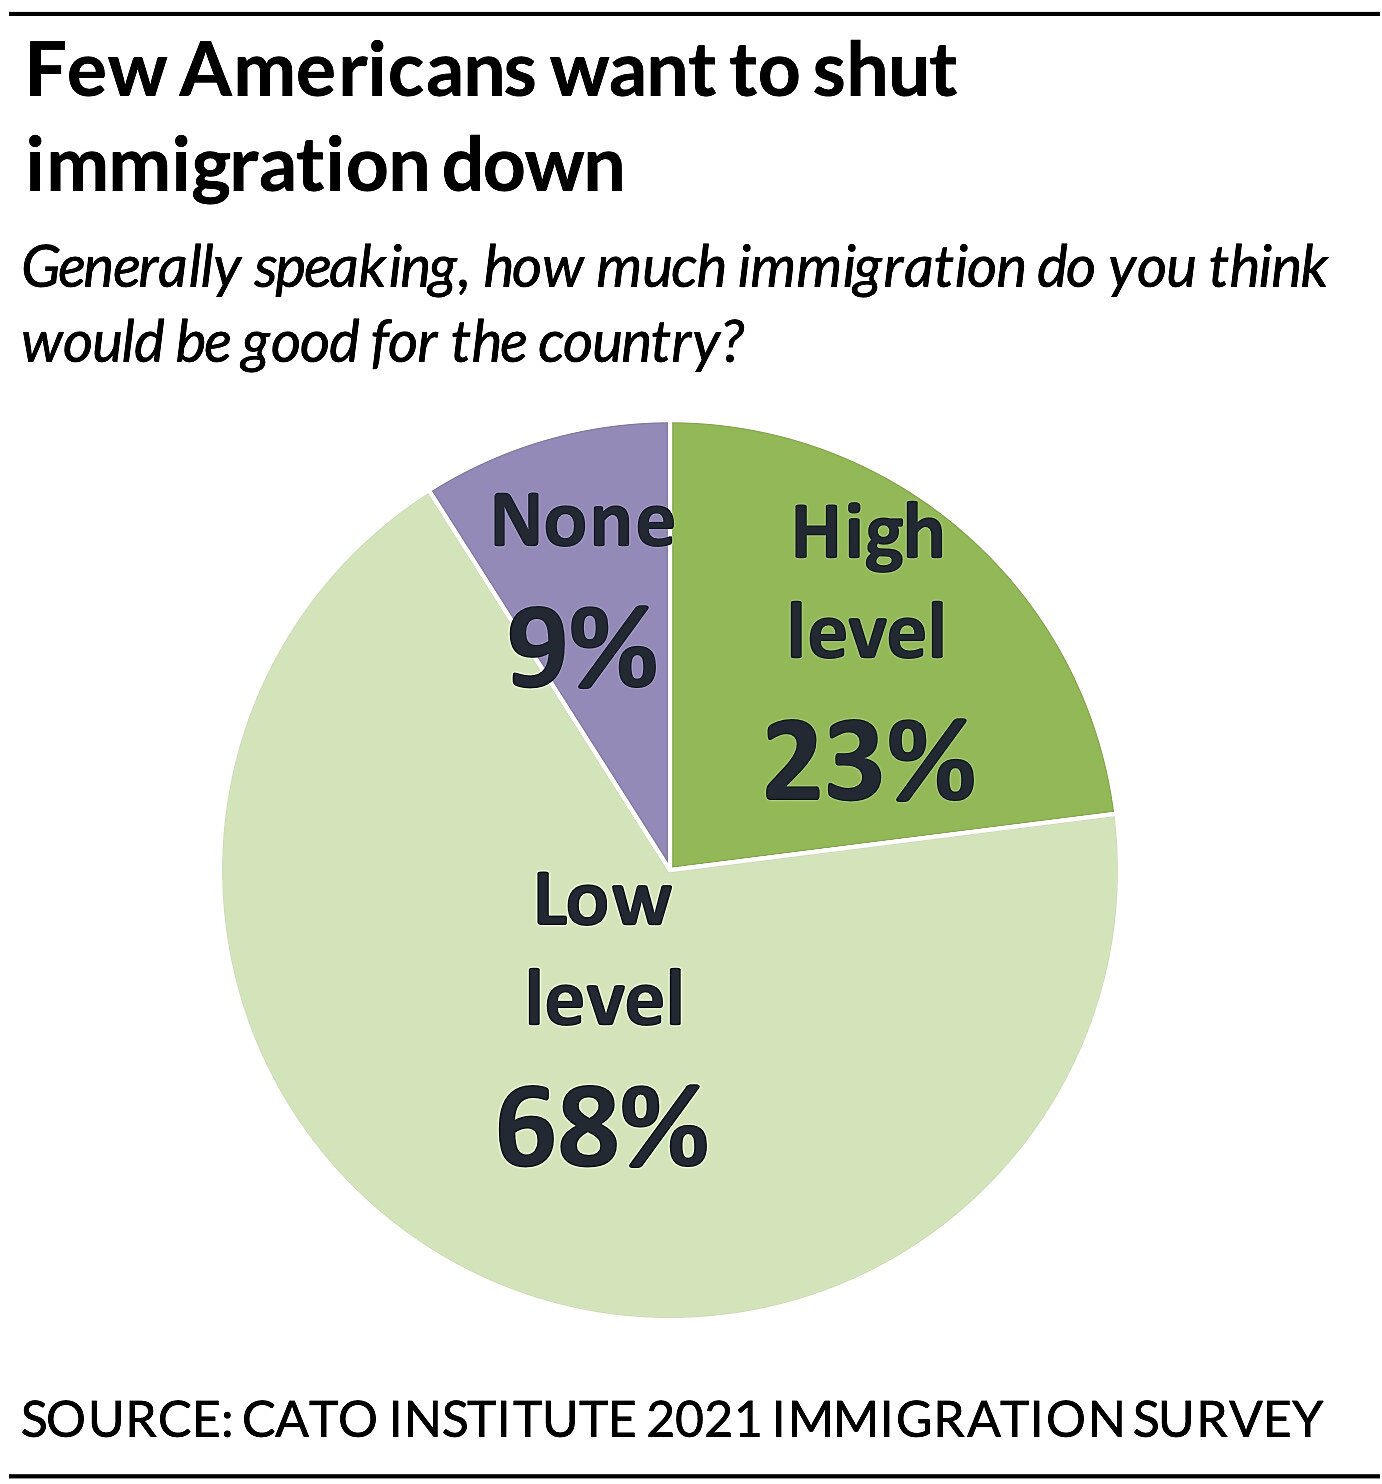
Only 9% of Americans want zero immigration into the United States today. Instead, 91% welcome immigration, including 68% who favor a “low level” and 23% who prefer a “high level” of immigration.
53% Say Ability to Immigrate Is a Human Right, But Few Want Fully Open Borders
53% of Americans believe that the “ability to immigrate to a new country is a human right for all people.” Democrats (72%) and libertarians (55%) are more likely than independents (45%) and Republicans (33%) to agree. At the same time, only 33% of the public favors removing “all restrictions on immigration” after the pandemic is over. Strong liberals stand out with 72% who favor open borders, while 54% of moderate liberals and 82% of conservatives oppose.
67% of Americans Believe the Legal Immigration Process Is “Fairly Difficult”
More than two-thirds (67%) think that the American immigration process is “fairly difficult” and support a number of reforms:
- 66% say businesses should not be required to give preference to American-born workers, but be allowed to hire whoever is most qualified regardless of nationality
- 63% support creating a new immigration visa for entrepreneurs
- 62% say businesses should be allowed to hire as many migrant workers as needed to fill vacant jobs, such as in agriculture, farming and construction
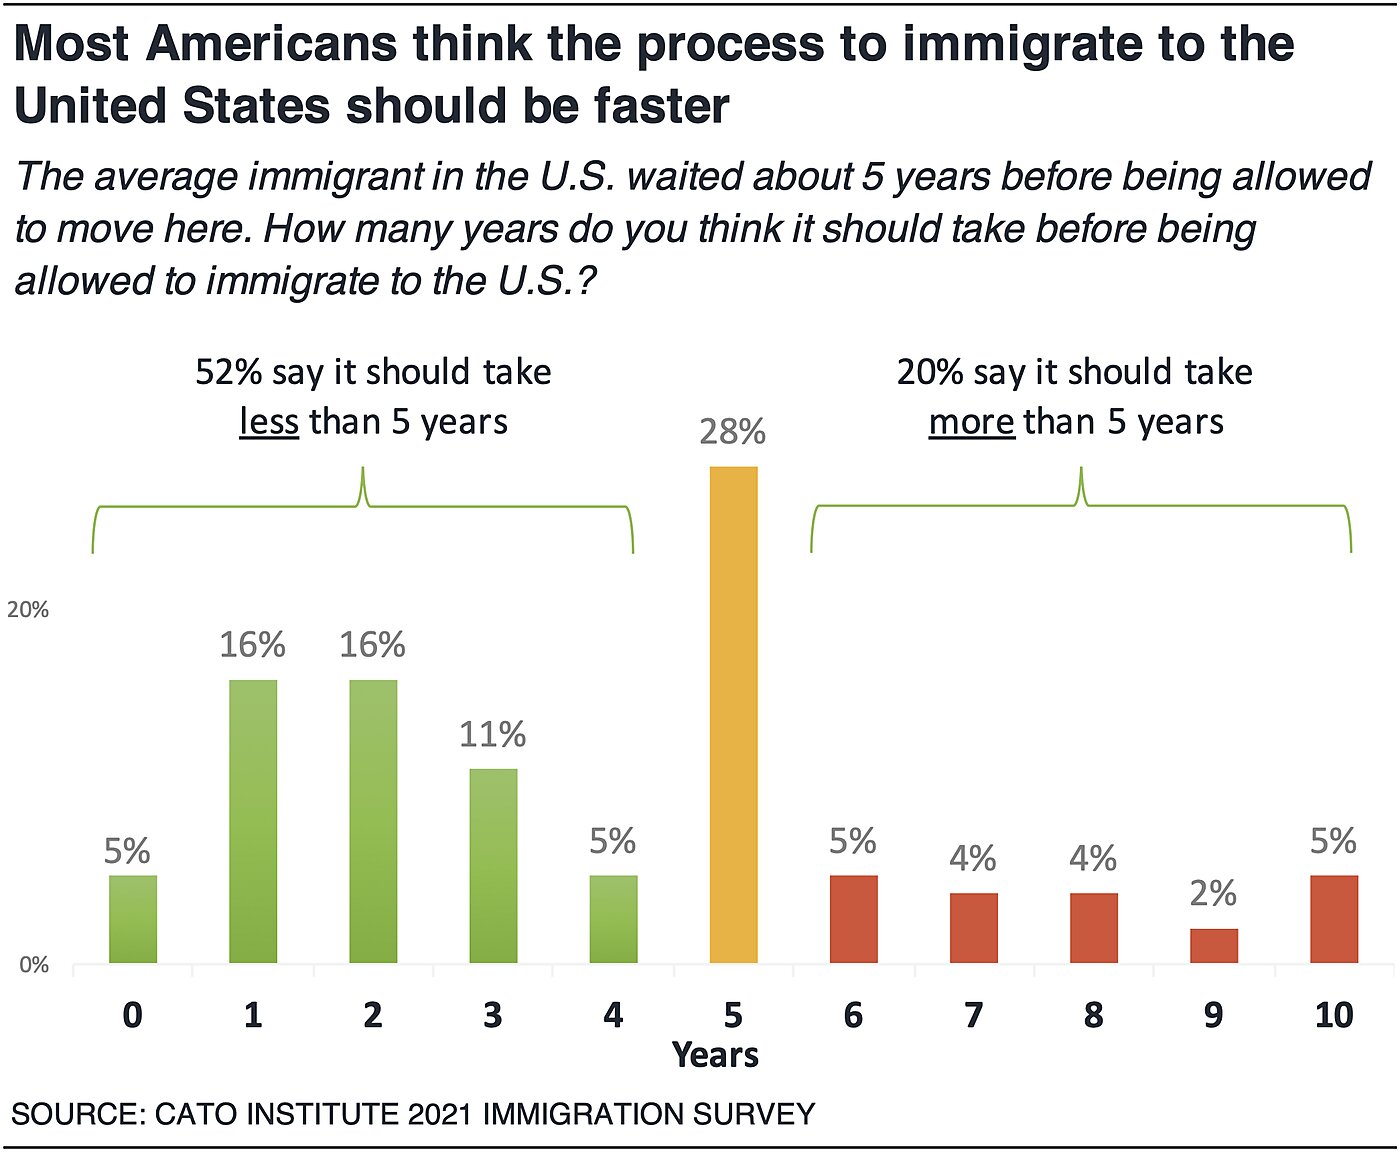
- 52% think the immigration process should be faster
- 86% oppose the immigration system giving priority to U.S. relatives: 58% say high-skilled and U.S. relatives should be given equal preference, and 28% prioritize high-skilled workers first
54% of Democrats Say Immigration Policy Should Prioritize What Helps the Most People Regardless of Nationality
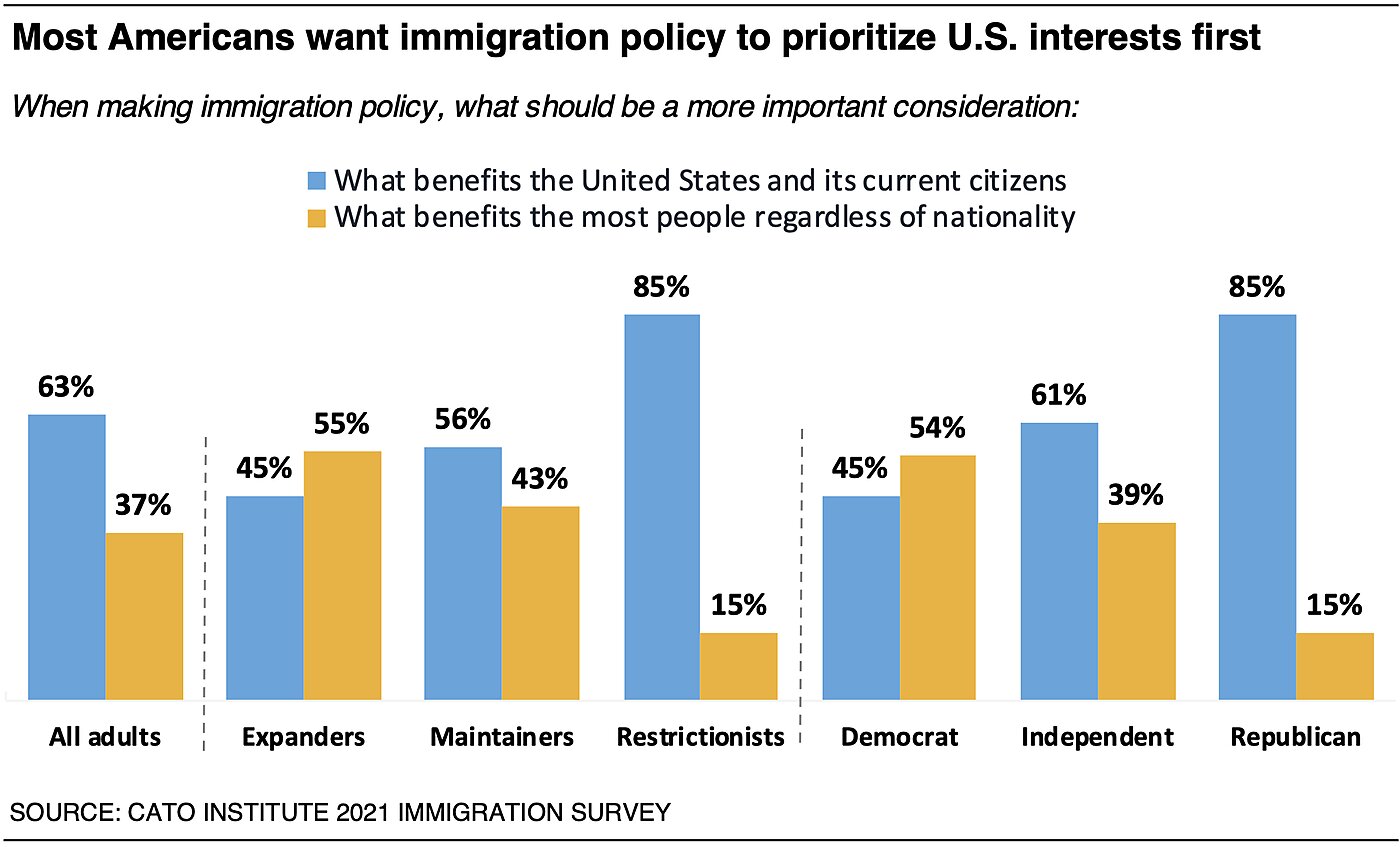
Most (63%) say that immigration policy should prioritize the interests of the U.S. and its current citizens. However, 54% of Democrats say that it should do what benefits the most people regardless of nationality, while 85% of Republicans say U.S. interests should come first.
59% of Republicans Say Voting on Immigration Levels and Origins Should Be Up to Voters
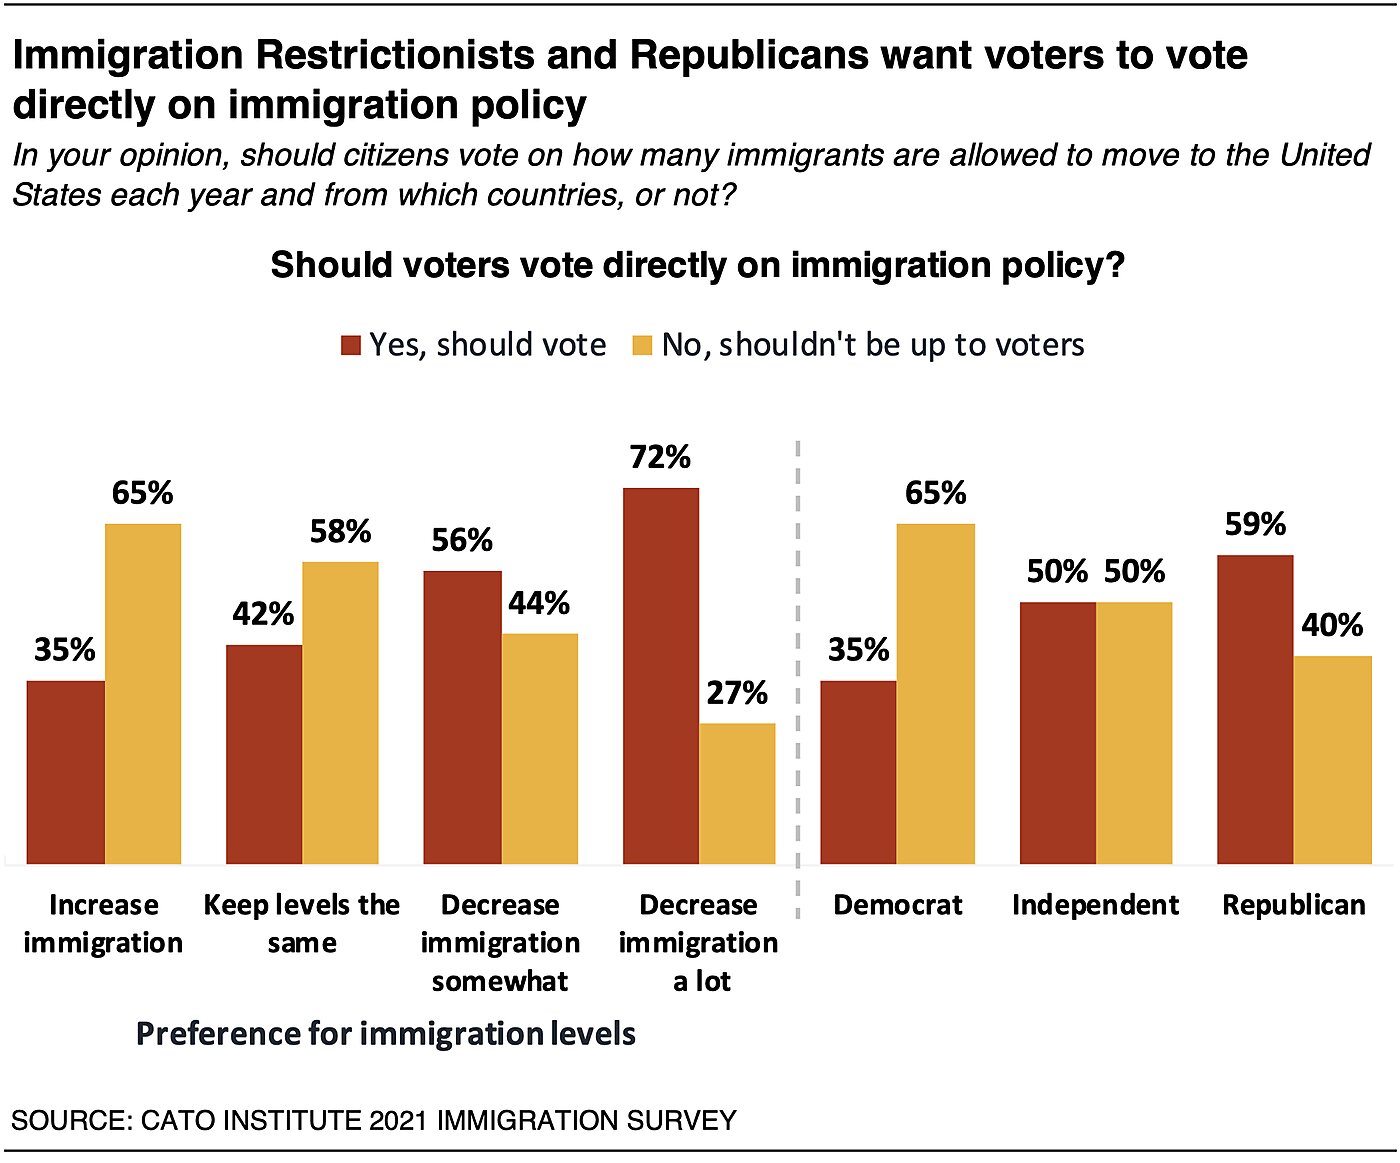
Less than half (47%) think voters should be able to vote on “how many immigrants are allowed to move to the United States each year and from which countries.” A majority (53%) say this “shouldn’t be up to voters.” Fifty-nine percent (59%) of Republicans say citizens should be able to directly vote on immigration levels and origins. However, two-thirds (65%) of Democrats disagree. Independents are evenly divided.
56% Say Simplifying the Legal Immigration Process is the Better Approach to Illegal Immigration
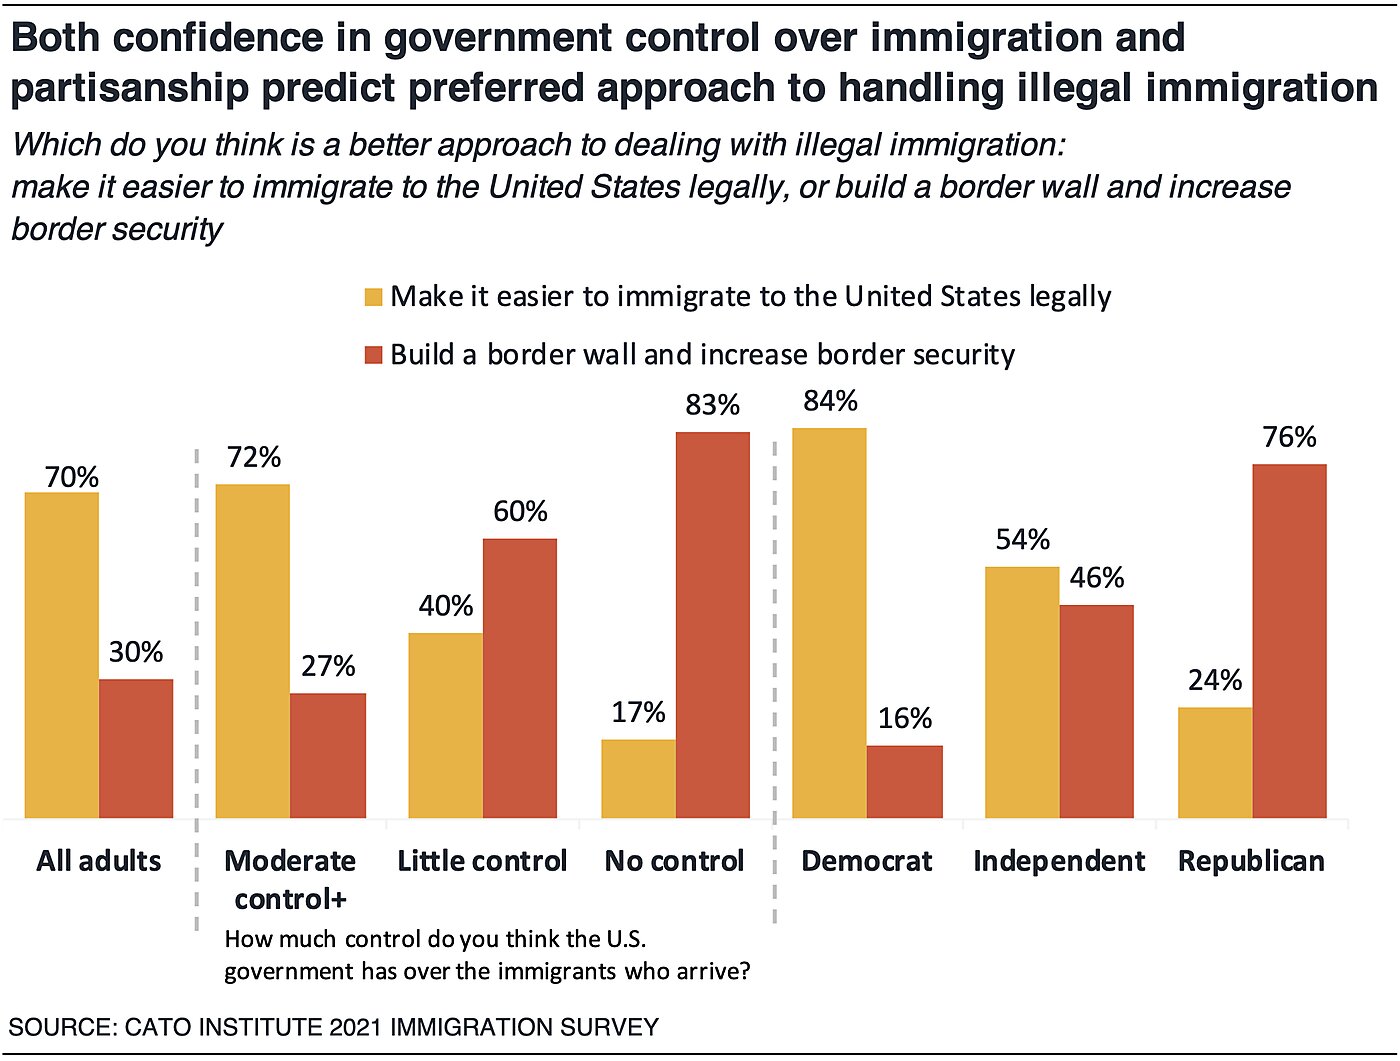
Americans say the better solution to illegal immigration is simplifying the legal immigration process (56%); fewer think increasing border security and building a border wall is the better approach (43%).
Confidence in the government’s ability to control who immigrates to the U.S. may contribute to these views: 72% of those who think the government has at least moderate control over immigration think simplifying the legal immigration process is a better solution to illegal immigration. But 67% of those who think the government has little or no control over immigration favor building a wall and increasing border security.
55% Support a Pathway to Citizenship for Unauthorized Immigrants
A majority (55%) also favor a pathway to citizenship for unauthorized immigrants currently living in the country, 18% favor legal residency without citizenship, 24% would deport all unauthorized immigrants, and 4% would do nothing.
68% of Strong Liberals Say It is “Acceptable” to Illegally Immigrate to the U.S.
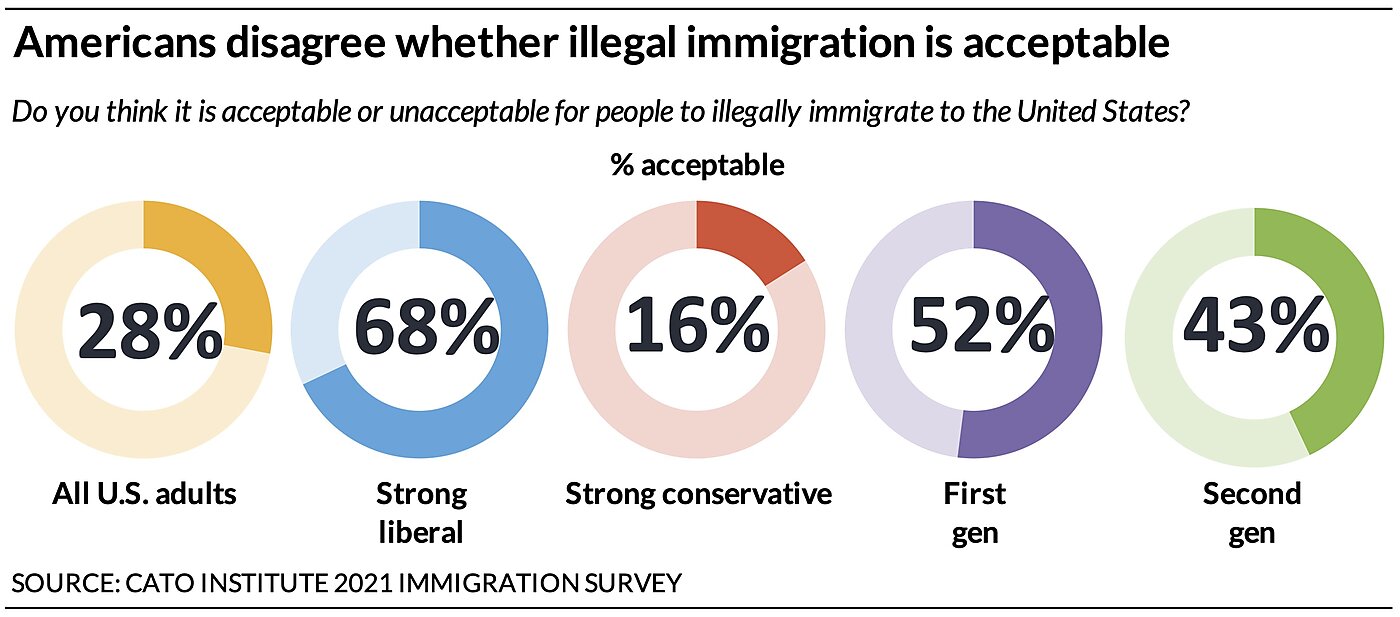
Nearly three-fourths (71%) of Americans say it is “unacceptable” for people to illegally immigrate to the U.S., although most (56%) support making the legal immigration process easier and 55% support providing a pathway to citizenship for the undocumented who are already here.
Strong liberals stand out, however, with 68% who say that illegal immigration is “acceptable.” This question divides Democrats. A majority (55%) of moderate liberals (as well as 84% of strong conservatives) disagree and say it is “unacceptable.”
58% of Republicans Support Stripping Citizenship of U.S.-Born Children of Undocumented Parents
When it comes to U.S.-born children of unauthorized immigrants: 61% favor granting automatic citizenship and 64% favor allowing them to attend U.S. public schools. Republicans stand out, however: 58% support stripping citizenship from U.S.-born children of undocumented parents and 58% oppose them attending U.S. public schools. Democrats oppose stripping citizenship (83%) and favor allowing the children to attend public schools (85%).
58% Support Increasing Immigration with Tighter Restrictions on Government Assistance
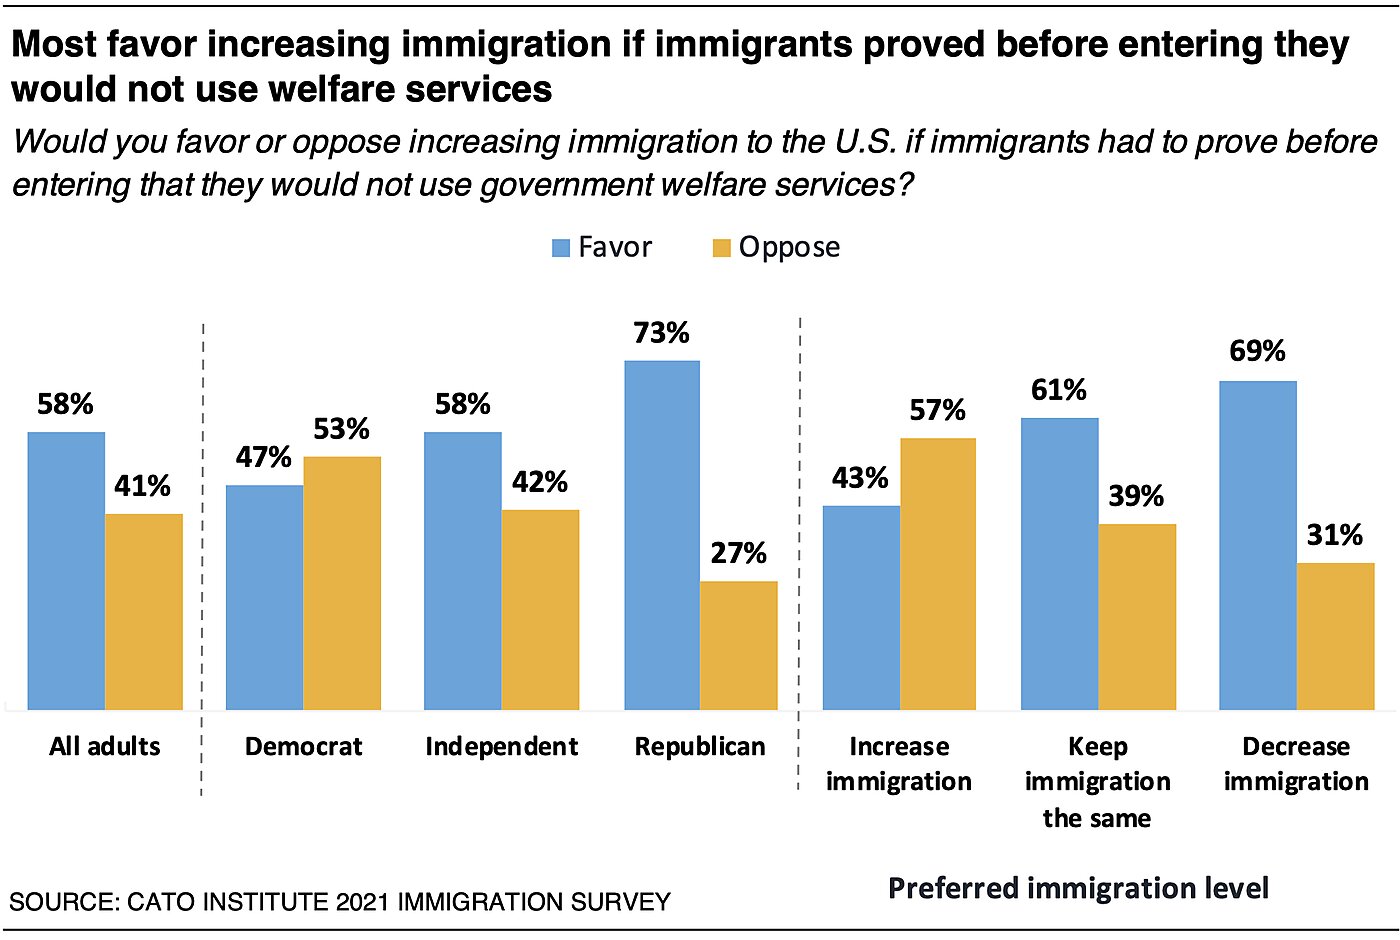
A majority of Americans believe that most immigrants (57%) or immigrant households (54%) receive some form of means-tested government assistance. However, a majority (58%) of Americans (including 73% of Republicans and 47% of Democrats) would favor increasing immigration if immigrants proved before entering that they would not use such assistance.
53% Oppose Allowing Immigrants to Receive Government Financial Assistance
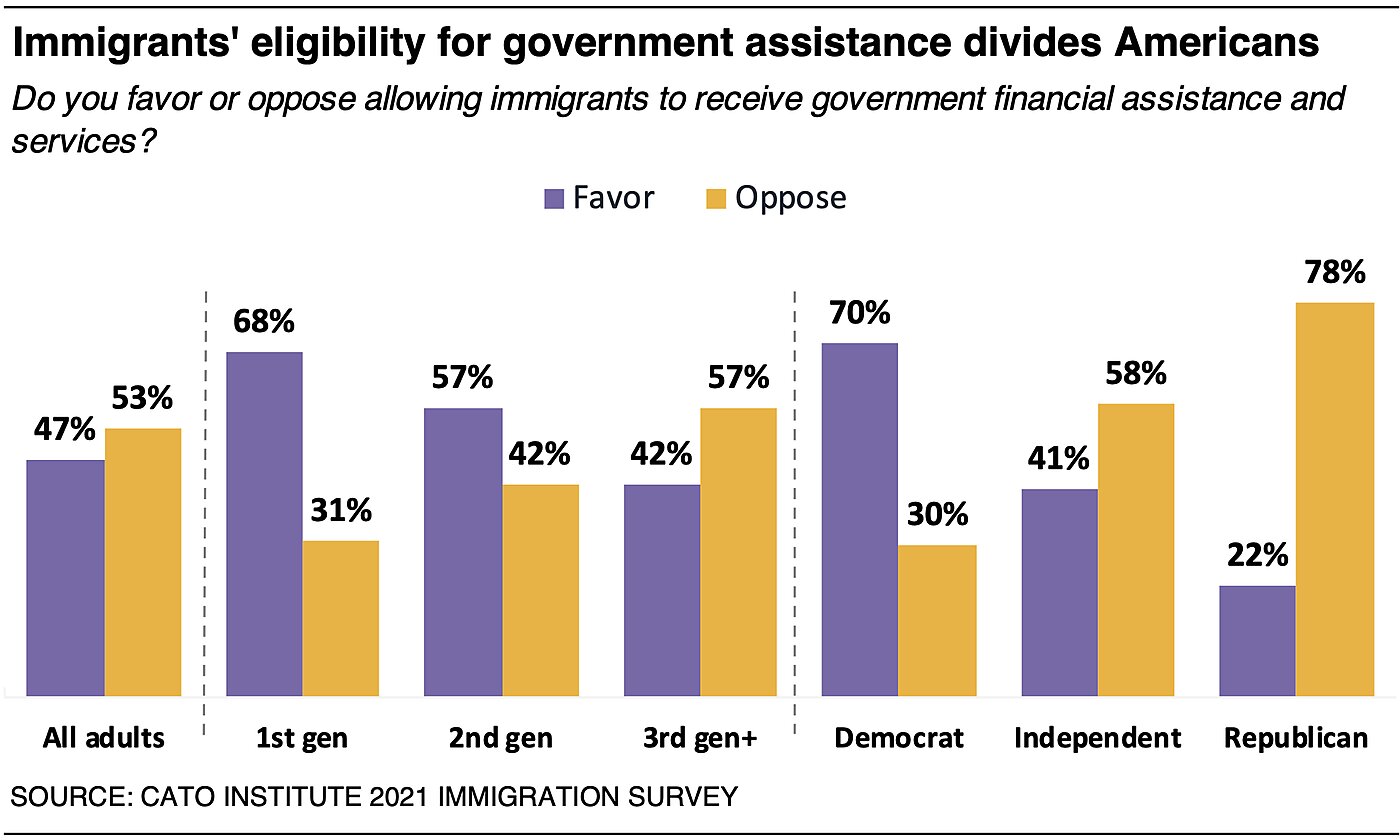
Most Americans (53%) oppose allowing immigrants to receive welfare services, including 78% of Republicans and 58% of independents, while 70% of Democrats favor.
How Americans Feel Toward Immigrants
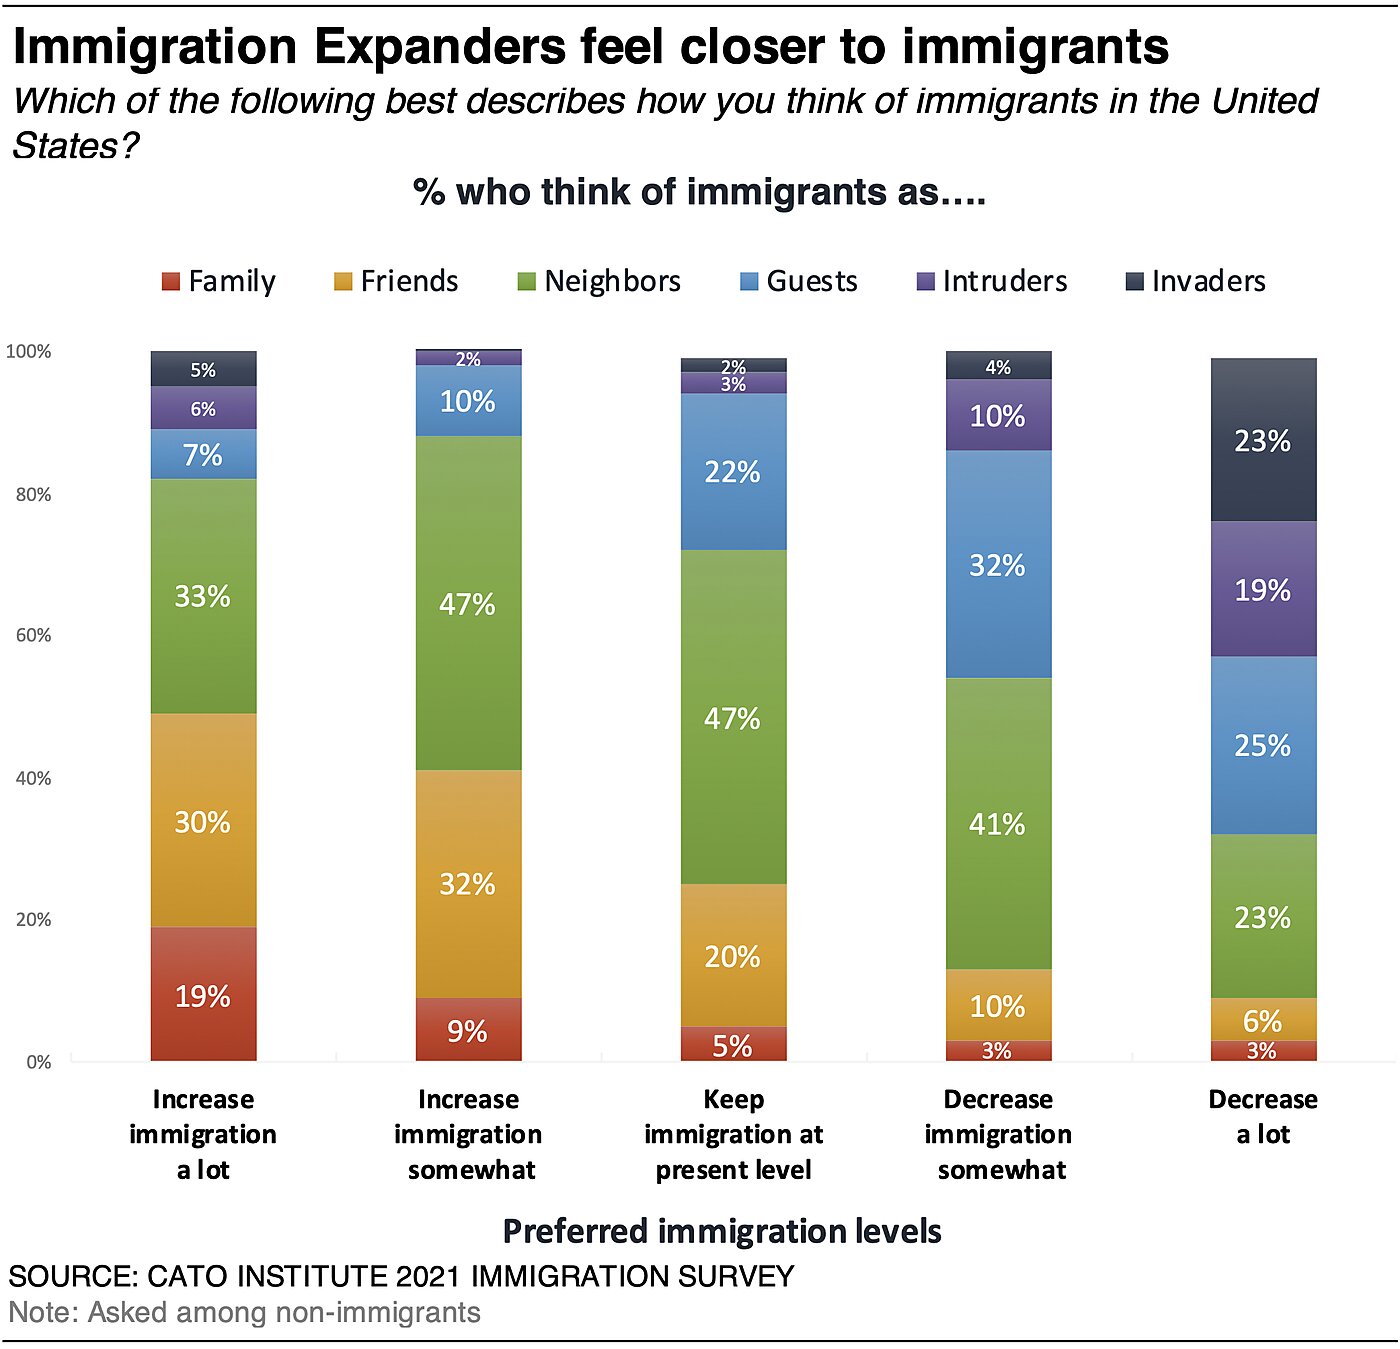
Americans differ in their perceptions of immigrants. When asked which best described how they feel about immigrants in the United States, 6% think of immigrants primarily as “family,” 19% as “friends,” 41% as “neighbors,” 21% as “guests,” 7% as “intruders,” and 6% as “invaders.”
Immigration Expanders are more likely than immigration Restrictionists to think of immigrants as “family” (11% vs. 3%), “friends” (31% vs. 8%), and “neighbors” (43% vs. 32%). Expanders are less likely than Restrictionists to think of immigrants as “guests” (9% vs. 29%), “intruders” (3% vs. 14%), or “invaders” (2% vs. 13%). While few (6%) Americans think of immigrants as “invaders,” one group stands out: among those who want to decrease immigration “a lot,” nearly a quarter (23%) think of immigrants primarily as “invaders.”
Liberals and Conservatives View Immigrants Unfavorably if they Join the Opposing Party
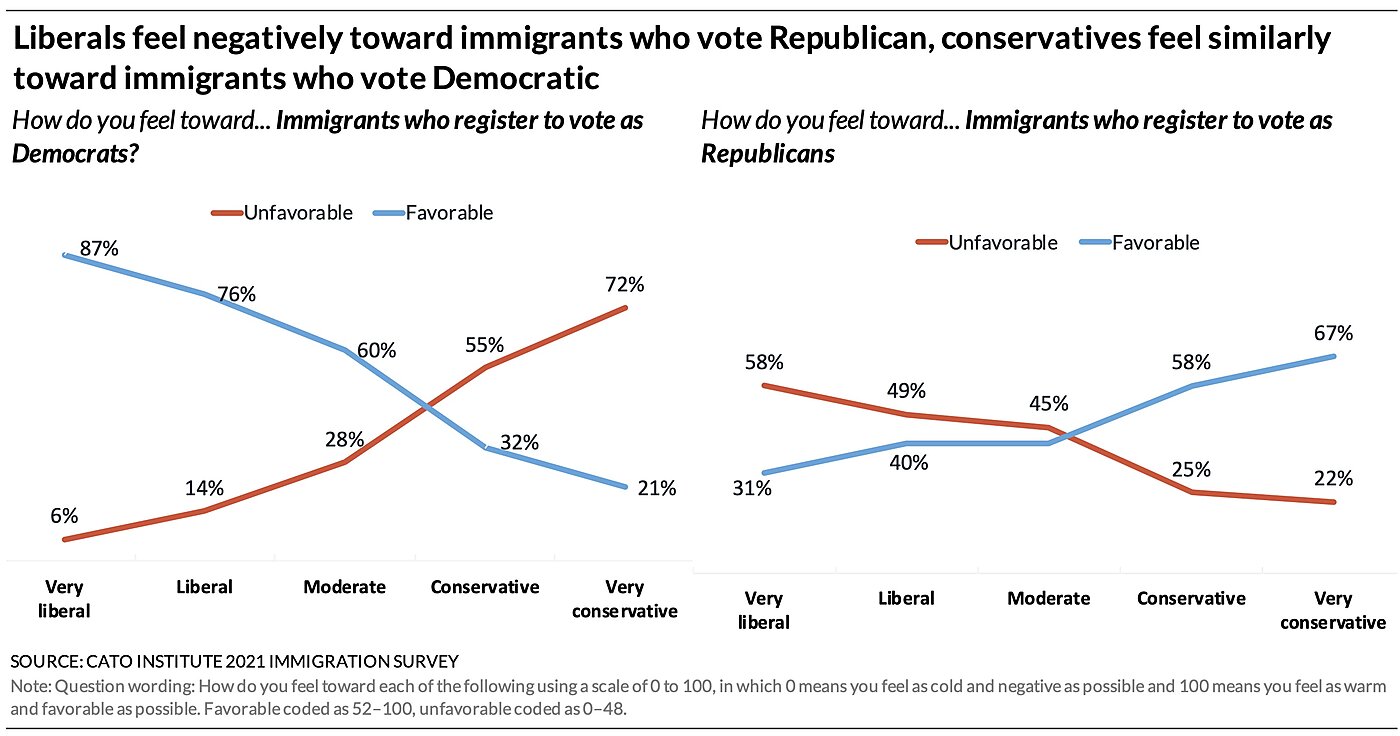
Fully 87% of strong liberals and 75% of liberals have favorable opinions of immigrants who join the Democratic Party. However, liberals turn against immigrants if they join the Republican party: 58% of strong liberals and 49% of liberals have unfavorable views of such immigrants. In a similar fashion, 67% of strong conservatives and 58% of conservatives have favorable views of immigrants who register as Republicans. However, conservatives turn even more strongly against immigrants if they register as Democrats: 72% of strong conservatives and 55% of conservatives have unfavorable views of Democratic immigrants.
Most Believe Immigration Benefits the United States
The public believes that immigration brings many benefits to the U.S.:
- 69% say immigration over time contributes to more economic growth
- 61% say immigration enriches American culture and values
- 58% say immigrants strengthen our country because of their hard work and talents
- 49% say immigration increases diversity of thought
- 48% agree the U.S. needs immigration to remain competitive in the global economy
- 48% say immigration enriches U.S. culture with new customs and food
- 46% say immigrants tend to be more entrepreneurial and start businesses
However, despite these many benefits 42% of Americans say immigration has been “mostly good” and 42% say immigration has been “equally good and bad” for the country; 16% say it’s been mostly bad. The survey documented fears some Americans have about immigration:
- 59% worry immigration could lead to too many demands on government services
- 55% of white respondents think discrimination against white Americans could happen over time
- 55% worry immigration could lead to less social cohesion and national unity
- 51% worry immigration over time could reduce jobs available
- 51% believe that unauthorized immigrants vote in elections
- 47% worry immigration increases the risk of terrorism a lot or somewhat
- 41% of white Americans worry immigration will cause them to become a minority in the U.S.
- 34% worry immigration reduces wages
Most Favor a “Melting Pot of Cultures”
Majorities of Republicans (80%), Democrats (65%), first-generation immigrants (72%), second-generation immigrants (63%), and the third generation and higher (71%) favor a “melting pot of cultures” rather than immigrants maintaining distinct cultures in the U.S.
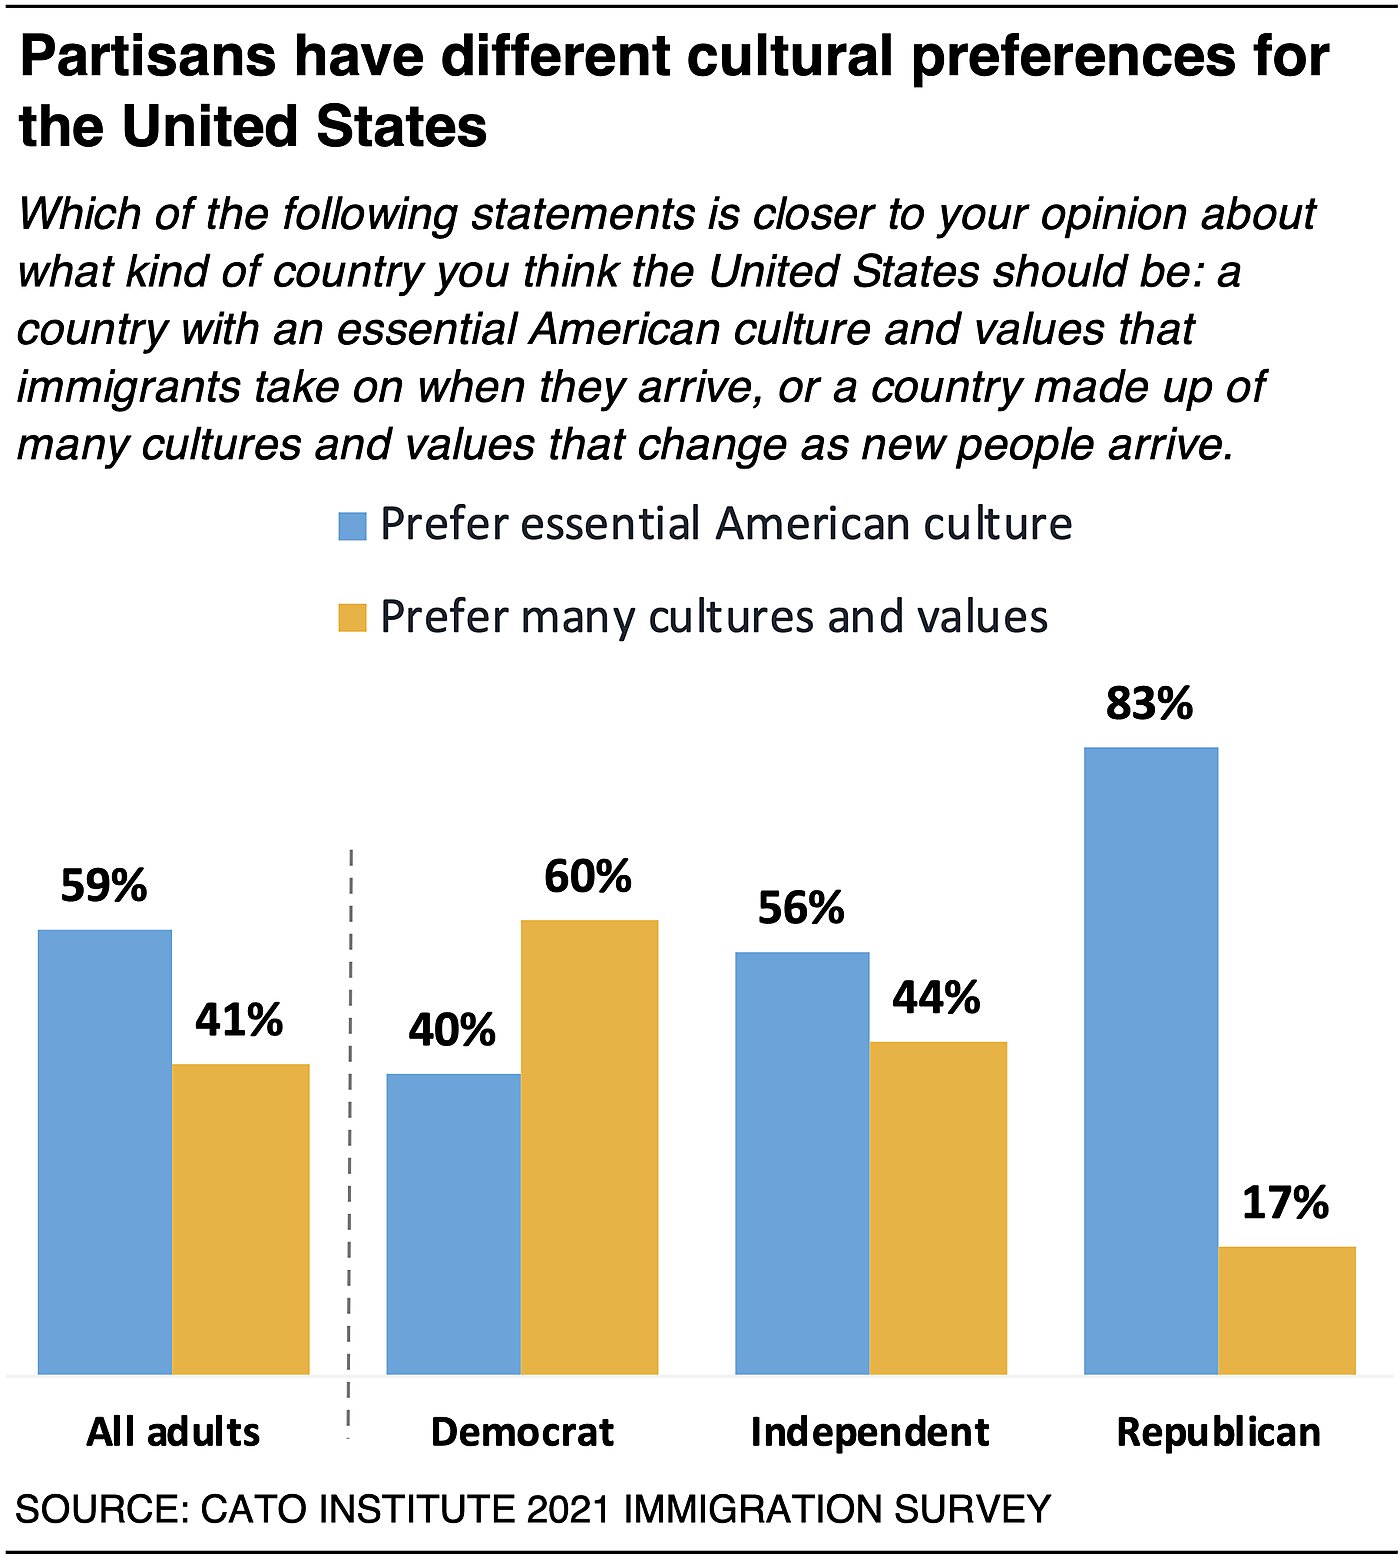
This may explain why most (59%) favor a country with an “essential American culture” that immigrants adopt when they arrive, while 41% favor a country comprised of many cultures and values that change as new people arrive. However, this question divides partisans. Majorities of Republicans (83%) and independents (56%) prefer a country with an essential American culture, while Democrats (60%) prefer a country comprising many different cultures.
Nearly three-fourths (74%) of first-generation immigrants say most people who have immigrated to the U.S. over the past 20 years have mostly adopted essential American culture rather than retained their own cultures. However, about half of second-generation immigrants, and 53% of the third generation and higher believe immigrants have mostly retained their own cultures and values rather than adopting essential American culture.
What Do People Think It Means to Be an American?
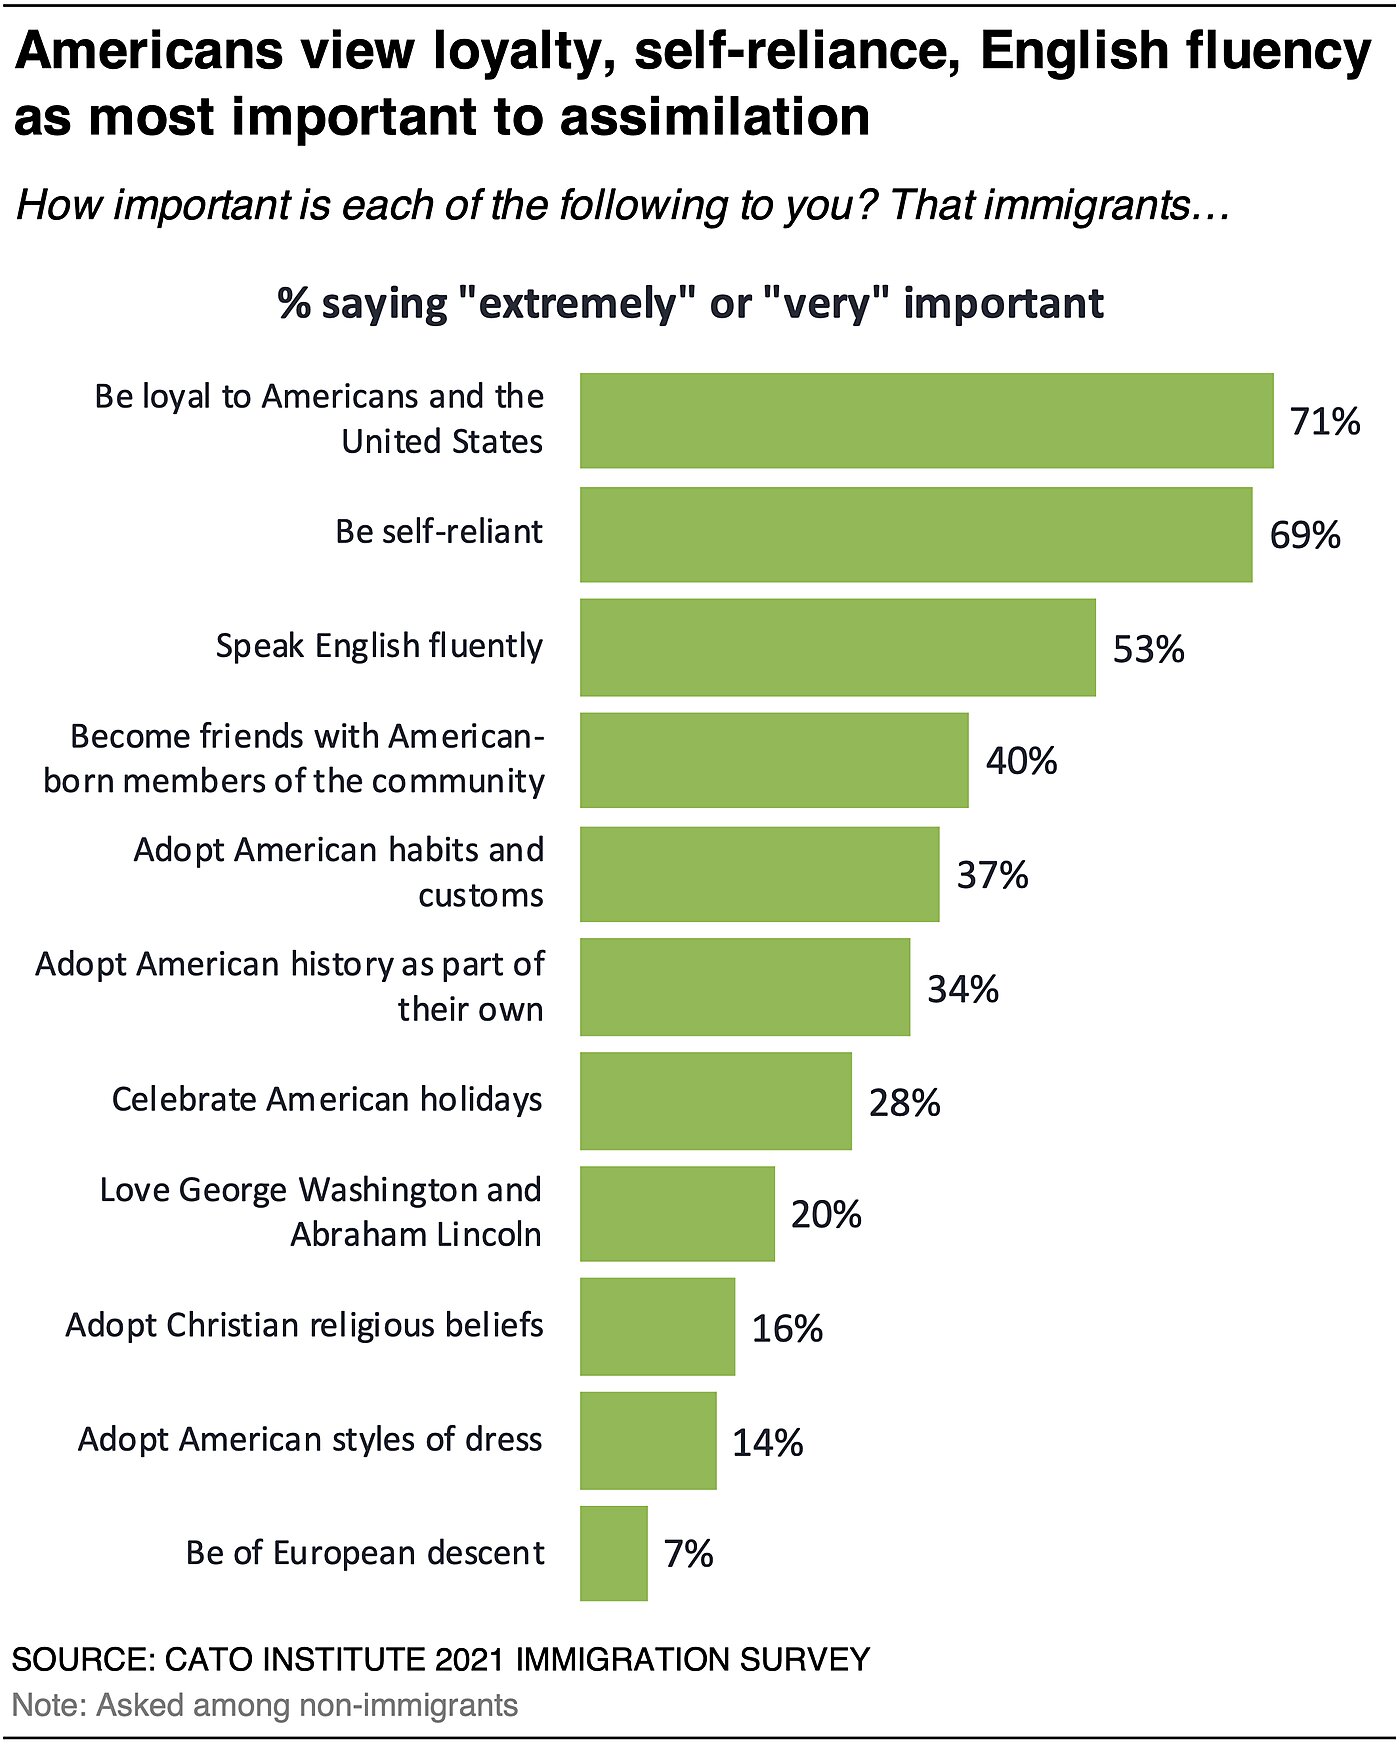
In order to understand what Americans mean when they say they want immigrants to assimilate into the larger society, the survey asked respondents how important it is to them for immigrants to do the following things:
Majorities of Americans say it is either “extremely” or “very” important to them that immigrants (1) be loyal to Americans and the United States (71%), (2) be self-reliant (69%), and (3) speak English fluently (53%).
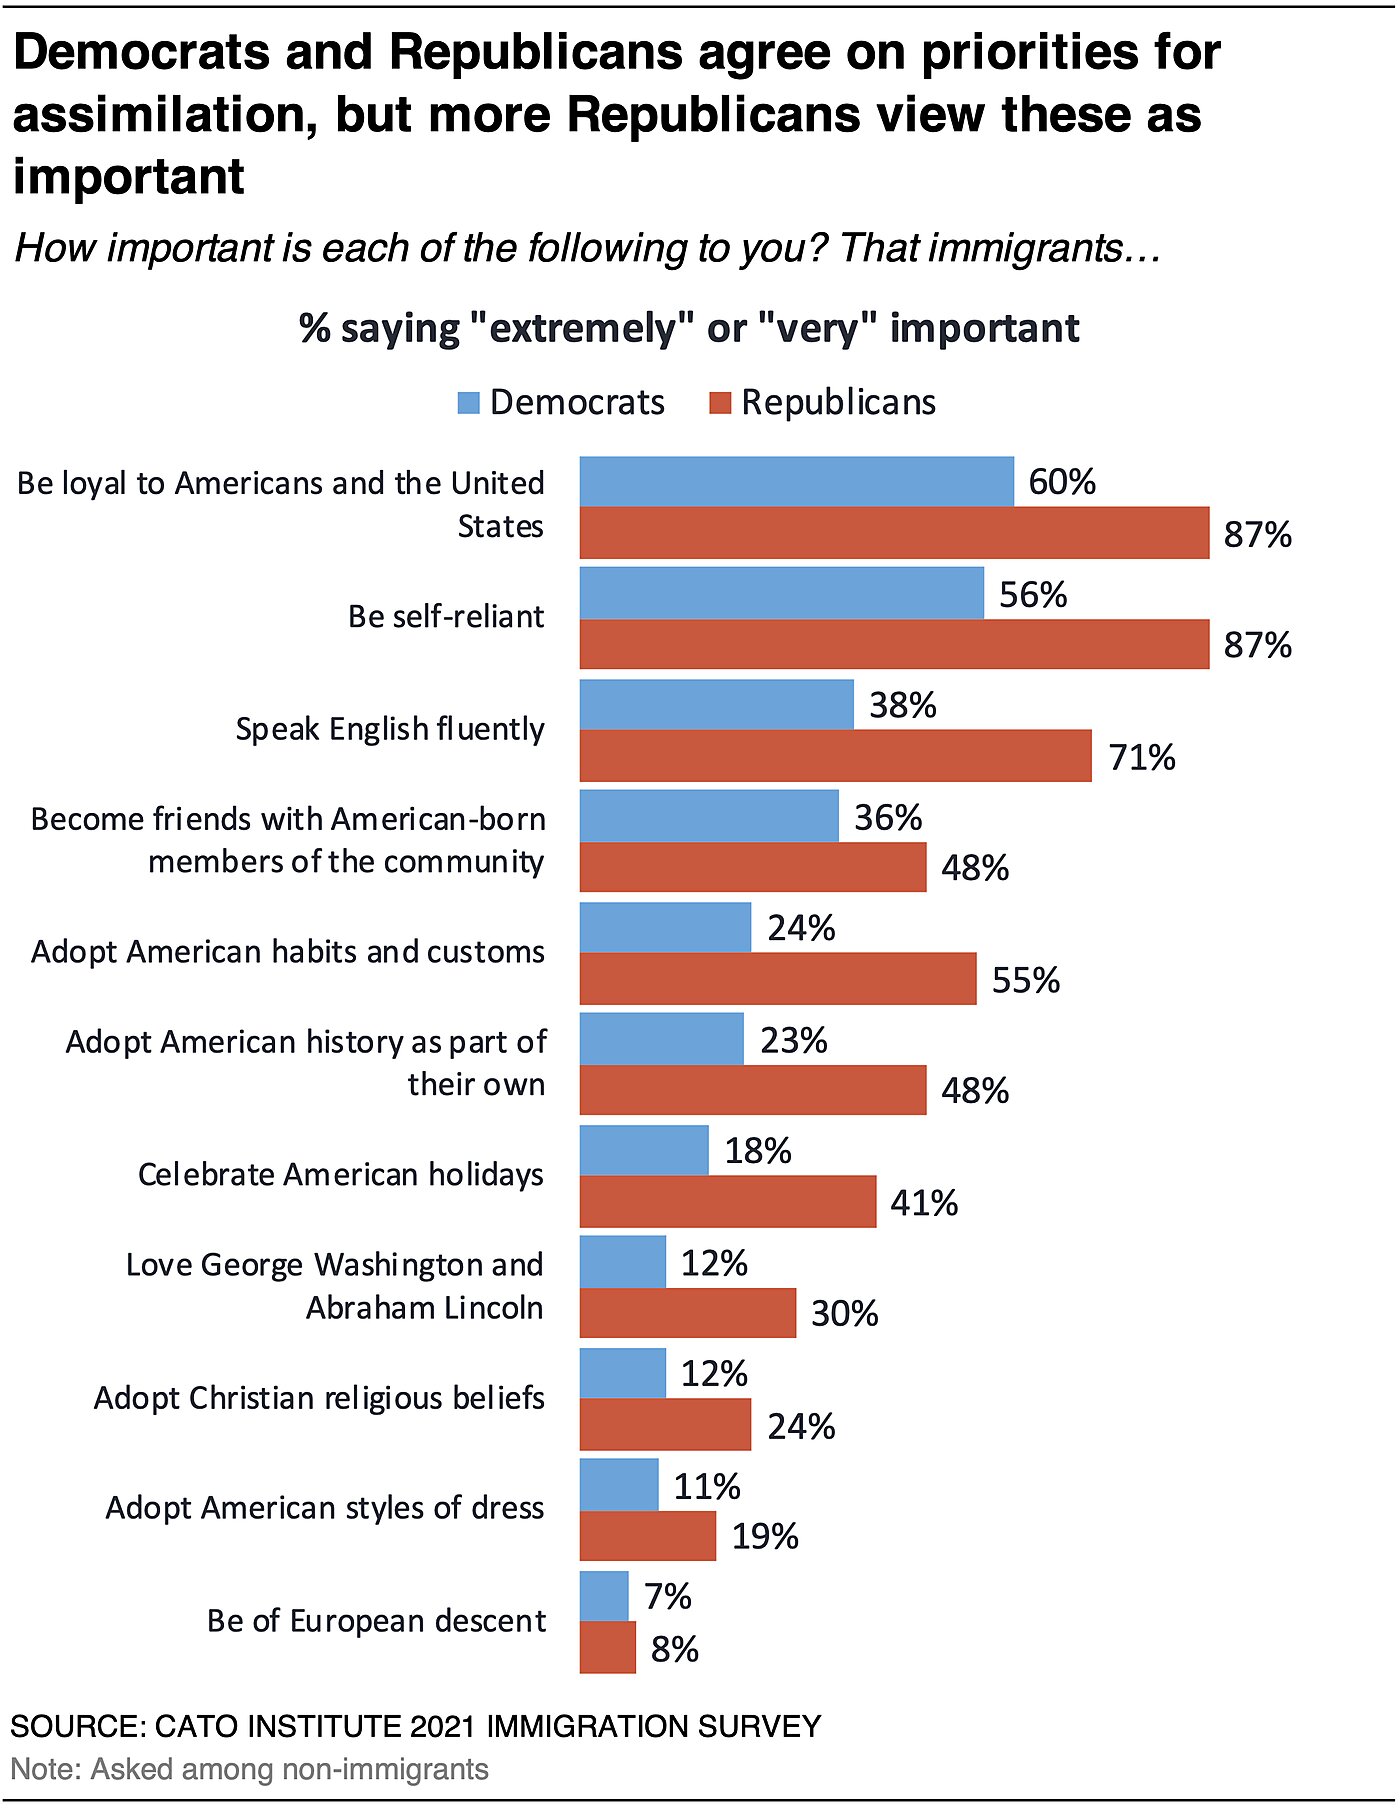
Democrats and Republicans disagree about assimilation preferences. Across the board, more Republicans think each of these factors is more important compared to Democrats.
Many Americans Prefer Neighbors Similar to Themselves
The survey investigated the extent to which immigration attitudes are shaped by neighborhood preferences. The characteristics that Americans are most likely to say they care a “great deal” about having in common with their neighbors are language (45%), values and sentiments (34%), customs and habits (28%), holidays (22%), political values (21%), religious beliefs (16%), and race or ethnicity (11%).
Republicans are more likely than Democrats to greatly prefer having similar neighbors that speak their same language (62% vs. 32%), share their values and sentiments (44% vs. 28%), customs and habits (38% vs. 22%), and holidays (32% vs. 16%). Partisan differences nearly evaporate, however, when including the share who say they care at least “a little” or “somewhat” about these things.
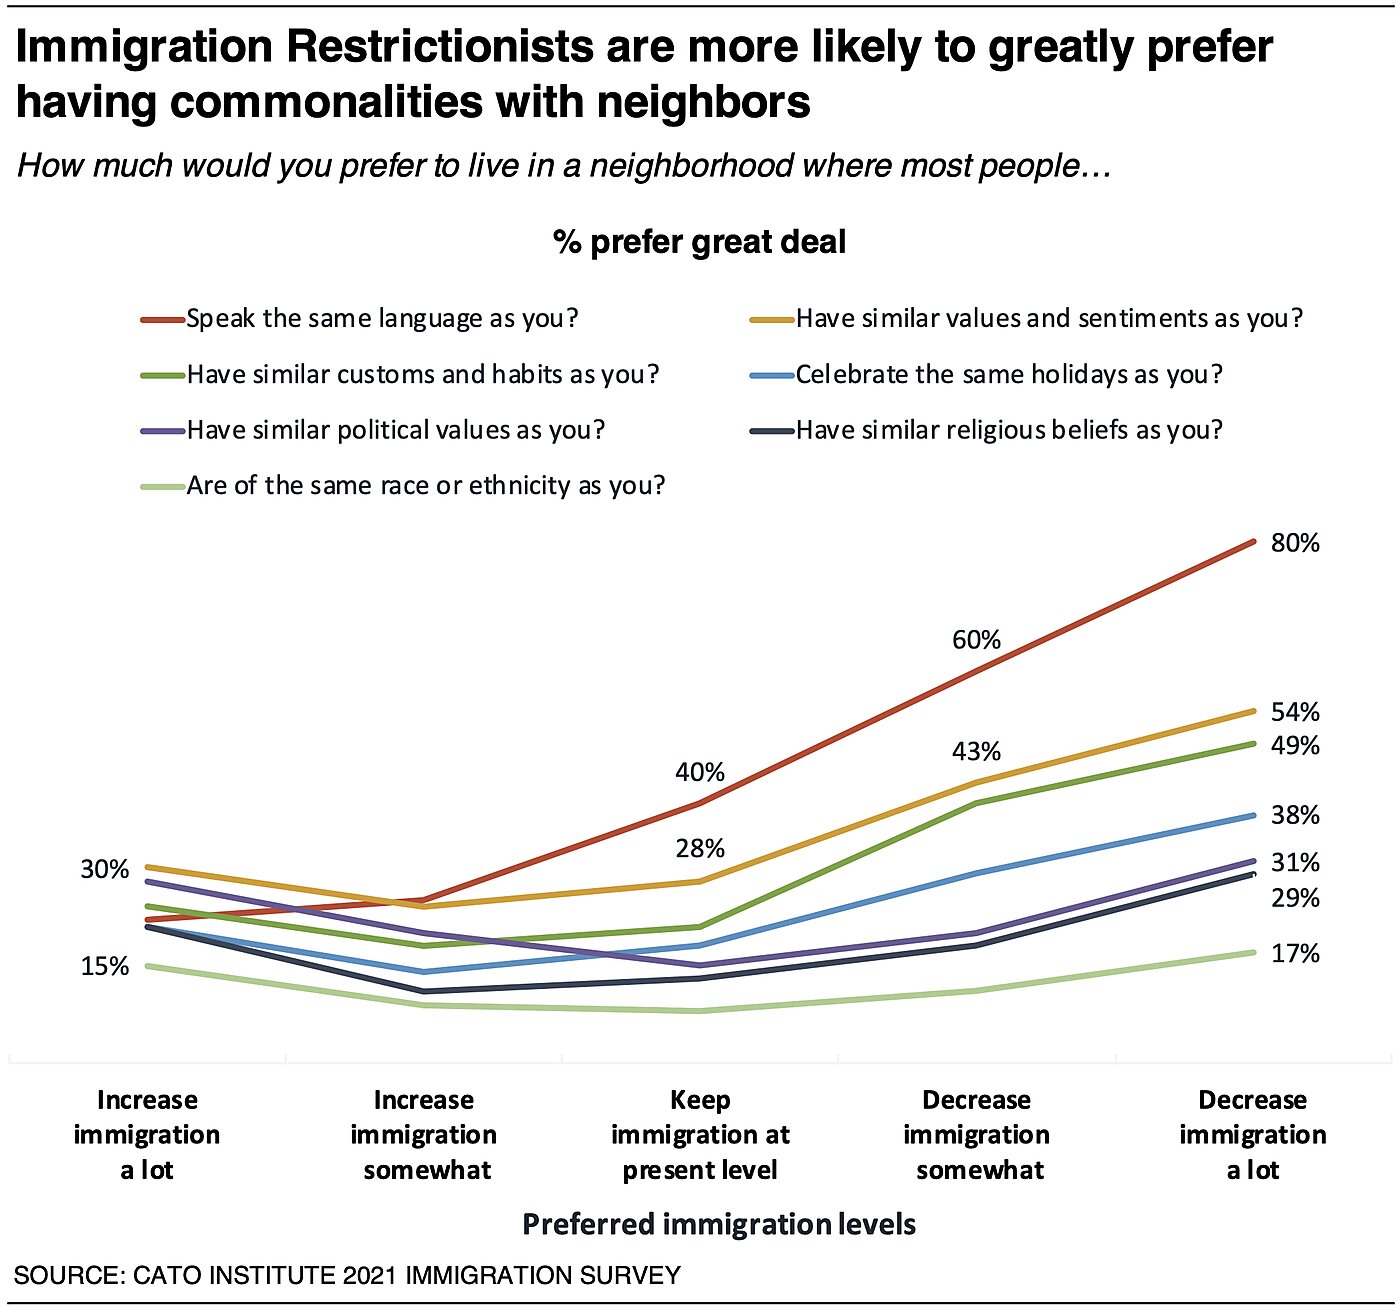
Similarly, those who want to restrict immigration are more likely than those who want to increase it to greatly prefer neighbors who speak their same language (69% vs. 24%), share their values and sentiments (48% vs. 26%), customs and habits (44% vs. 19%), and celebrate the same holidays (33% vs. 16%).
58% of Strong Liberals See Themselves as Global Citizens
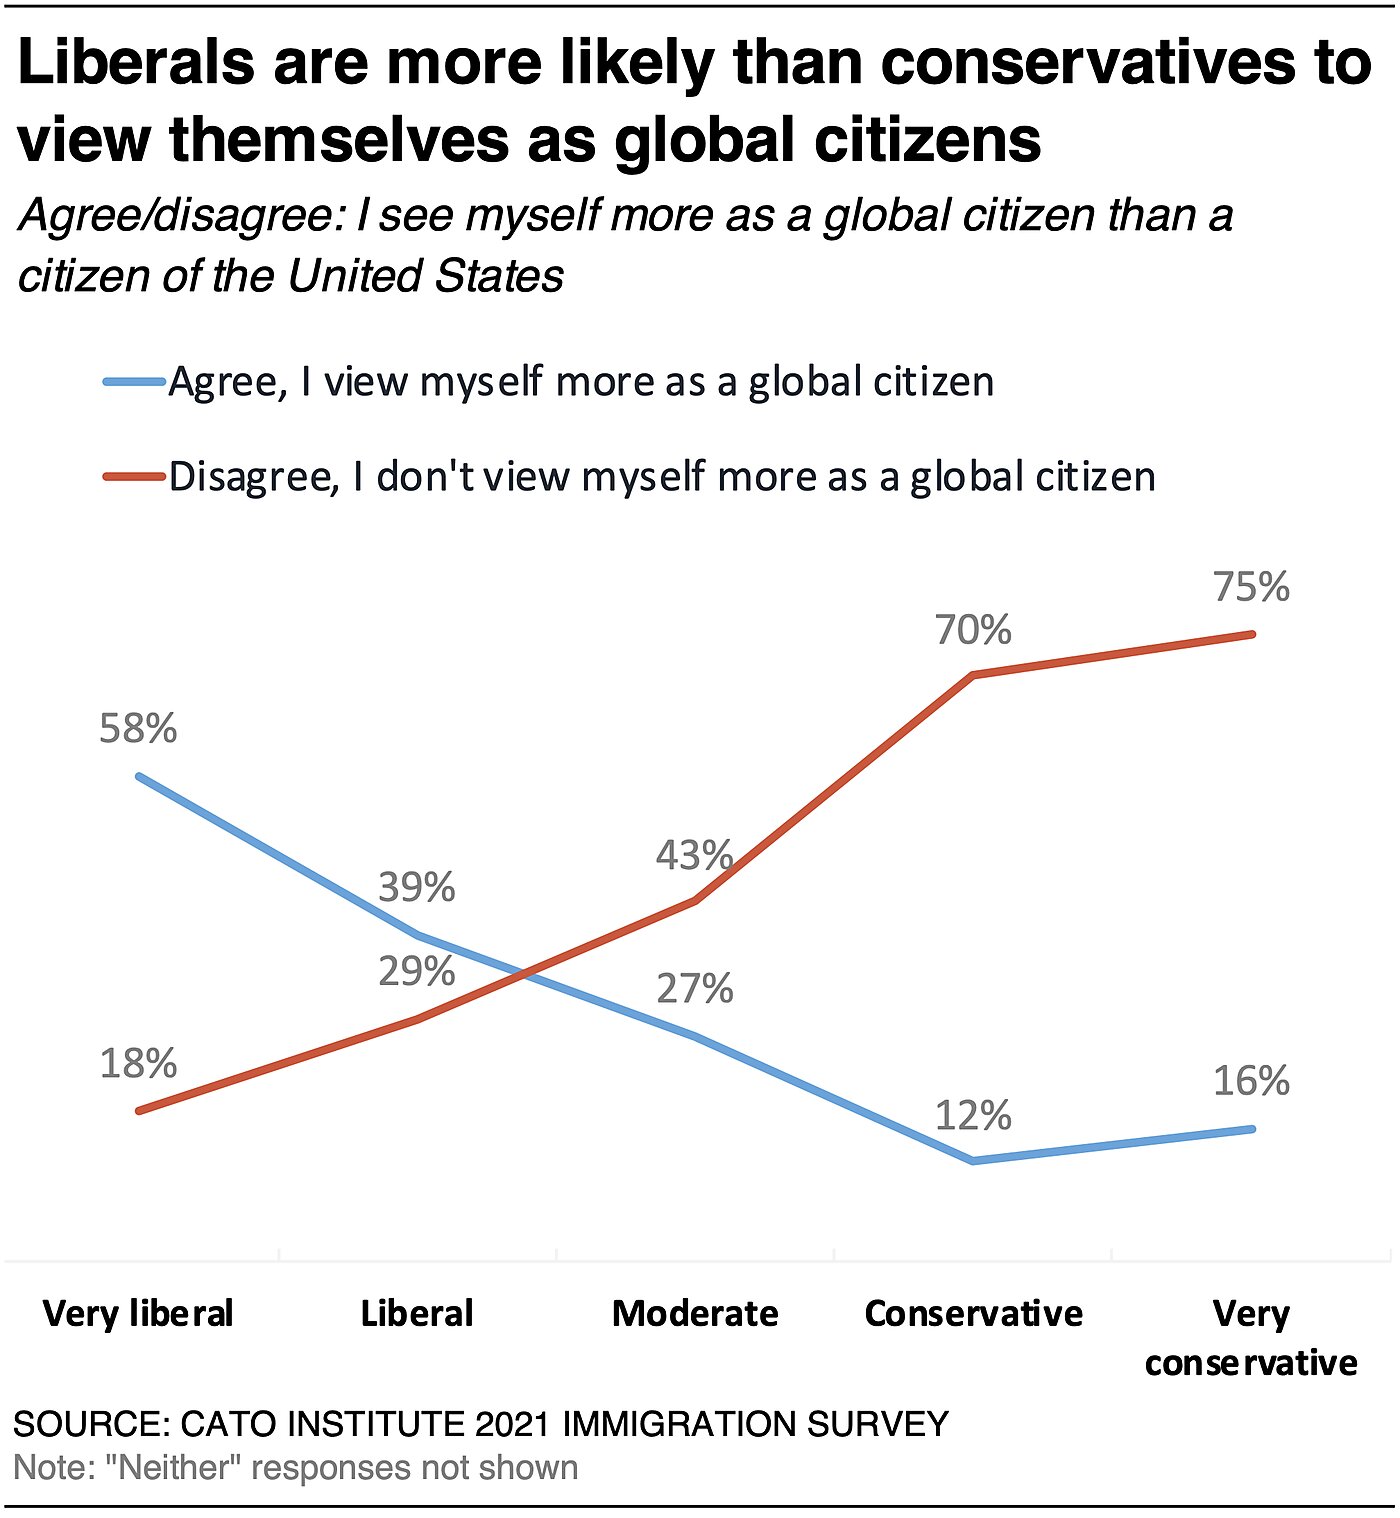
About a quarter (28%) of Americans view themselves more as a “global citizen than as a citizen of the United States,” and 58% of strong liberals agree. In contrast, 71% of strong conservatives view themselves first as U.S. citizens.
A novel thought experiment asked respondents if they felt a closer attachment to a stranger living in Wyoming or France. Democrats feel an equal connection to both (57%), while Republicans feel a stronger connection to the American stranger (70%).
Immigrants are Patriotic Despite More Experiences of Being Treated Like Outsiders
Eighty-two percent (82%) of Americans say they are patriotic, including 45% who feel “very patriotic” and 37% who feel “somewhat patriotic.” Majorities of Democrats (74%), Republicans (94%), first-generation immigrants (74%), second-generation immigrants (68%), and the third generation and higher (85%) all agree. But intensity varies. Republicans (67%) are more than twice as likely than Democrats (29%) to say they are very patriotic. First- (33%) and second-generation (29%) immigrants are somewhat less likely than the third generation and higher (49%) to feel very patriotic.
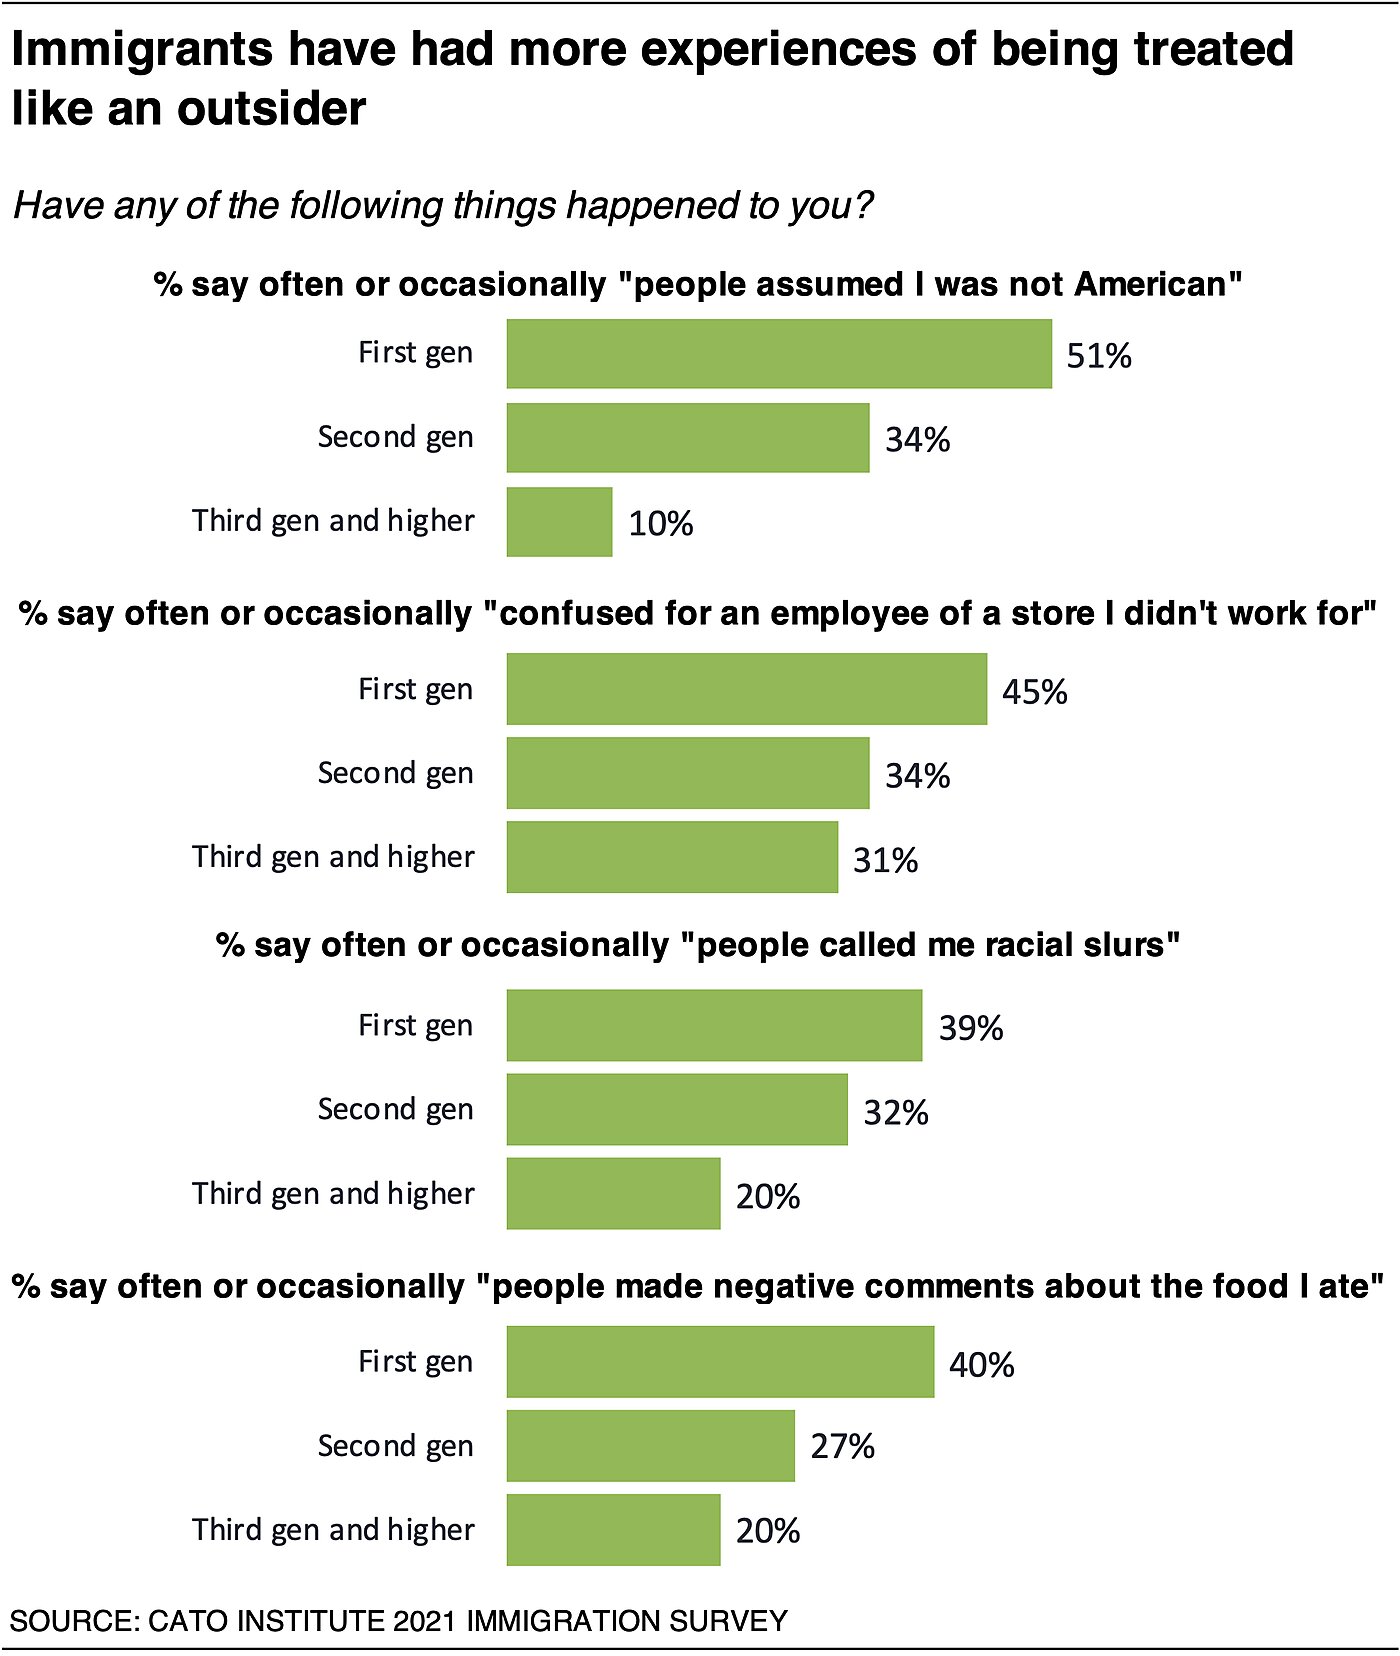
An overwhelming majority (80%) of immigrants say they feel grateful to be Americans. They say this despite being more likely to report experiences of being treated like an outsider. For instance, first-generation immigrants are more likely than the third generation and higher to say that others frequently or occasionally presumed they were not American (51% vs. 10%), confused them for a store employee where they didn’t work (45% vs. 31%), called them racial slurs (39% vs. 20%), or made negative comments about the food they ate (40% vs. 20%).
Most Immigrants Come for Economic Opportunity
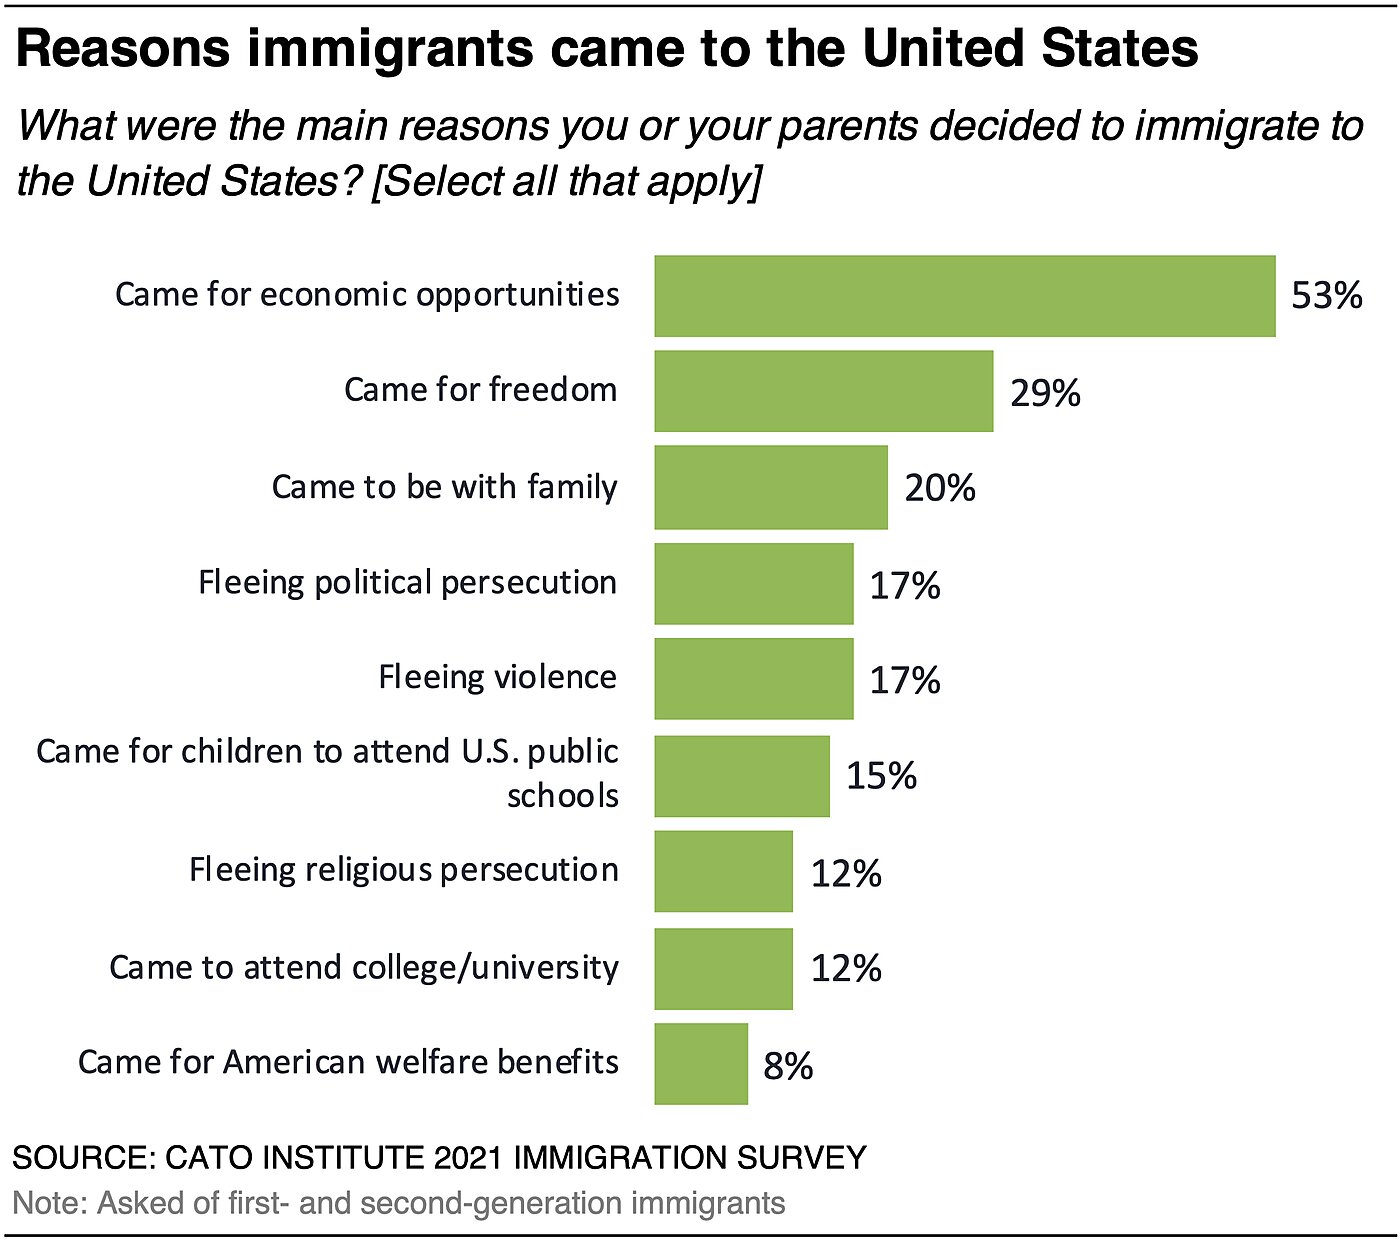
Most first- and second-generation immigrants say their families came to the U.S. for economic opportunities (53%) and freedom (29%). Nearly half (46%) say their families came fleeing persecution of some kind, including political (20%), religious (12%), or general violence (17%). Others came to attend U.S. colleges or K‑12 public schools (27%), be with family (20%), and 8% came for welfare benefits.
69% of Republicans Support Deporting an Immigrant Who Thinks Americans Are Racist
A majority (54%) of Americans say that an immigrant legally residing in the U.S. who “disliked America and said Americans are racist” should be deported, while 46% oppose. Republicans (69%) and independents (52%) agree, while Democrats oppose (57%).
Immigrants and Non-Immigrants Oppose Larger Government if it Requires High Taxes
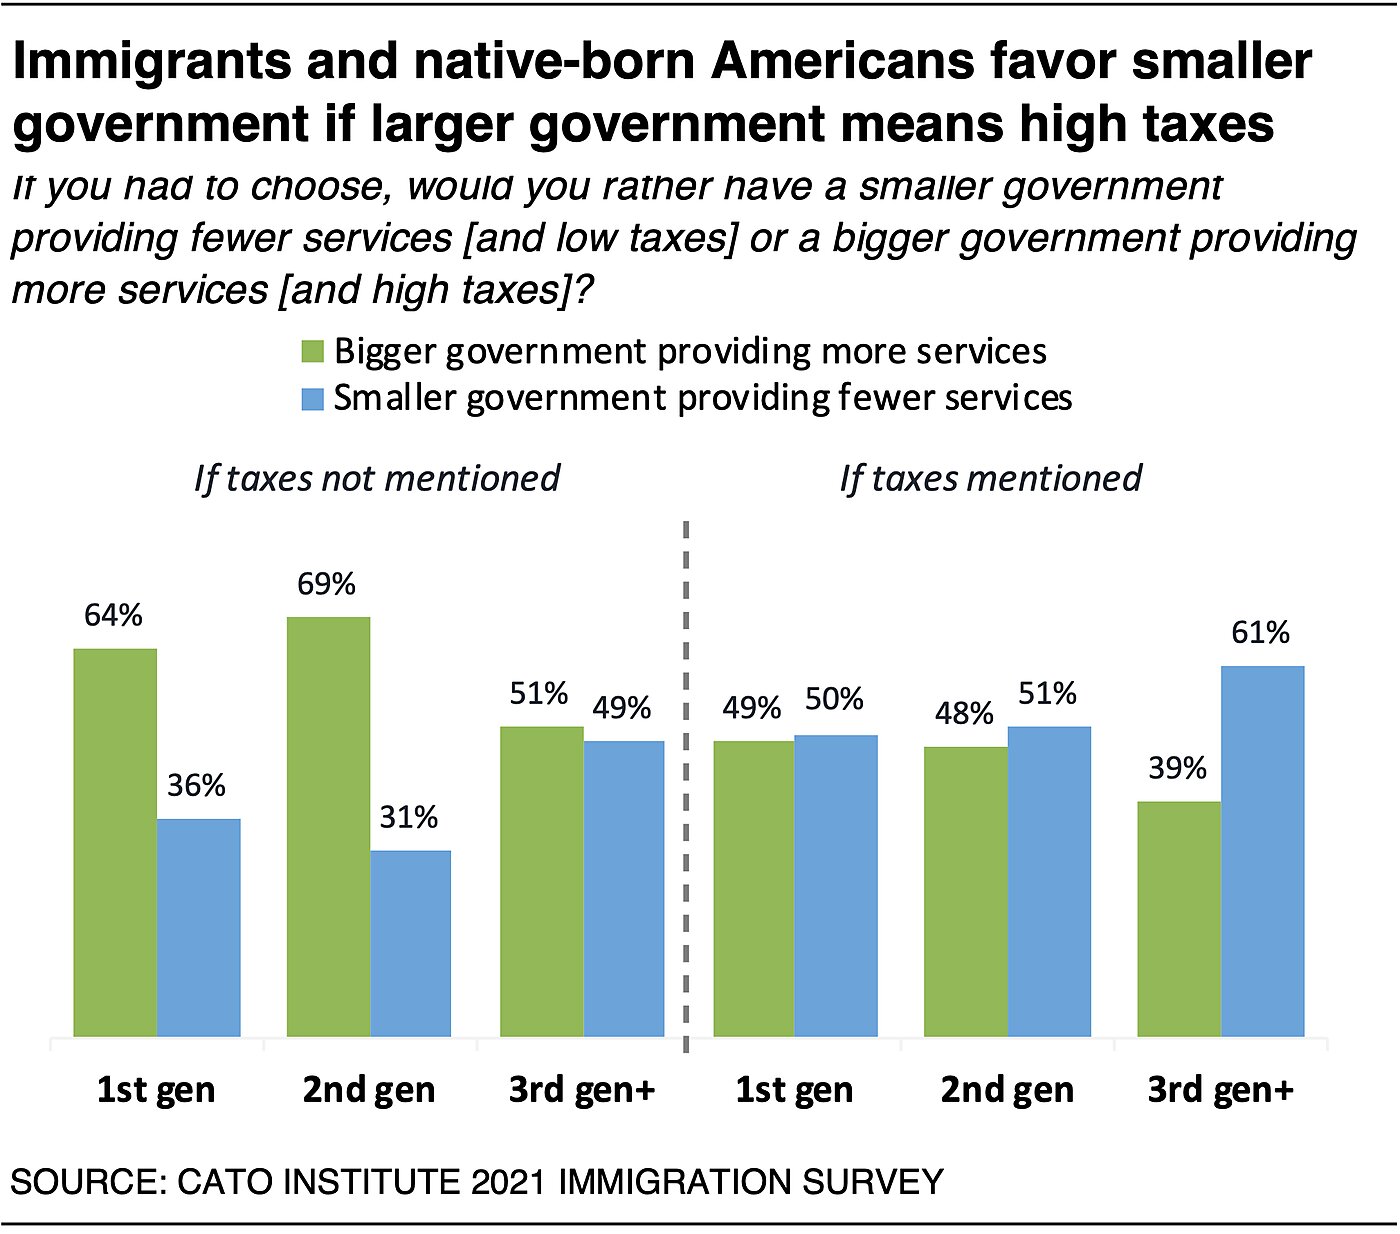
Mentioning tax rates diminishes the gap between immigrants and non-immigrants when it comes to the size and scope of government. Without mentioning taxes, about two-thirds of first- (64%) and second-generation (69%) immigrants and 51% of the third generation and higher favor “larger government providing more services.” However, if providing these additional services requires higher taxes, then 50% of first-generation, 51% of second-generation, and 61% of the third generation and higher prefer a smaller government offering fewer services and low taxes.
Support for Socialism Slides in Later Generations
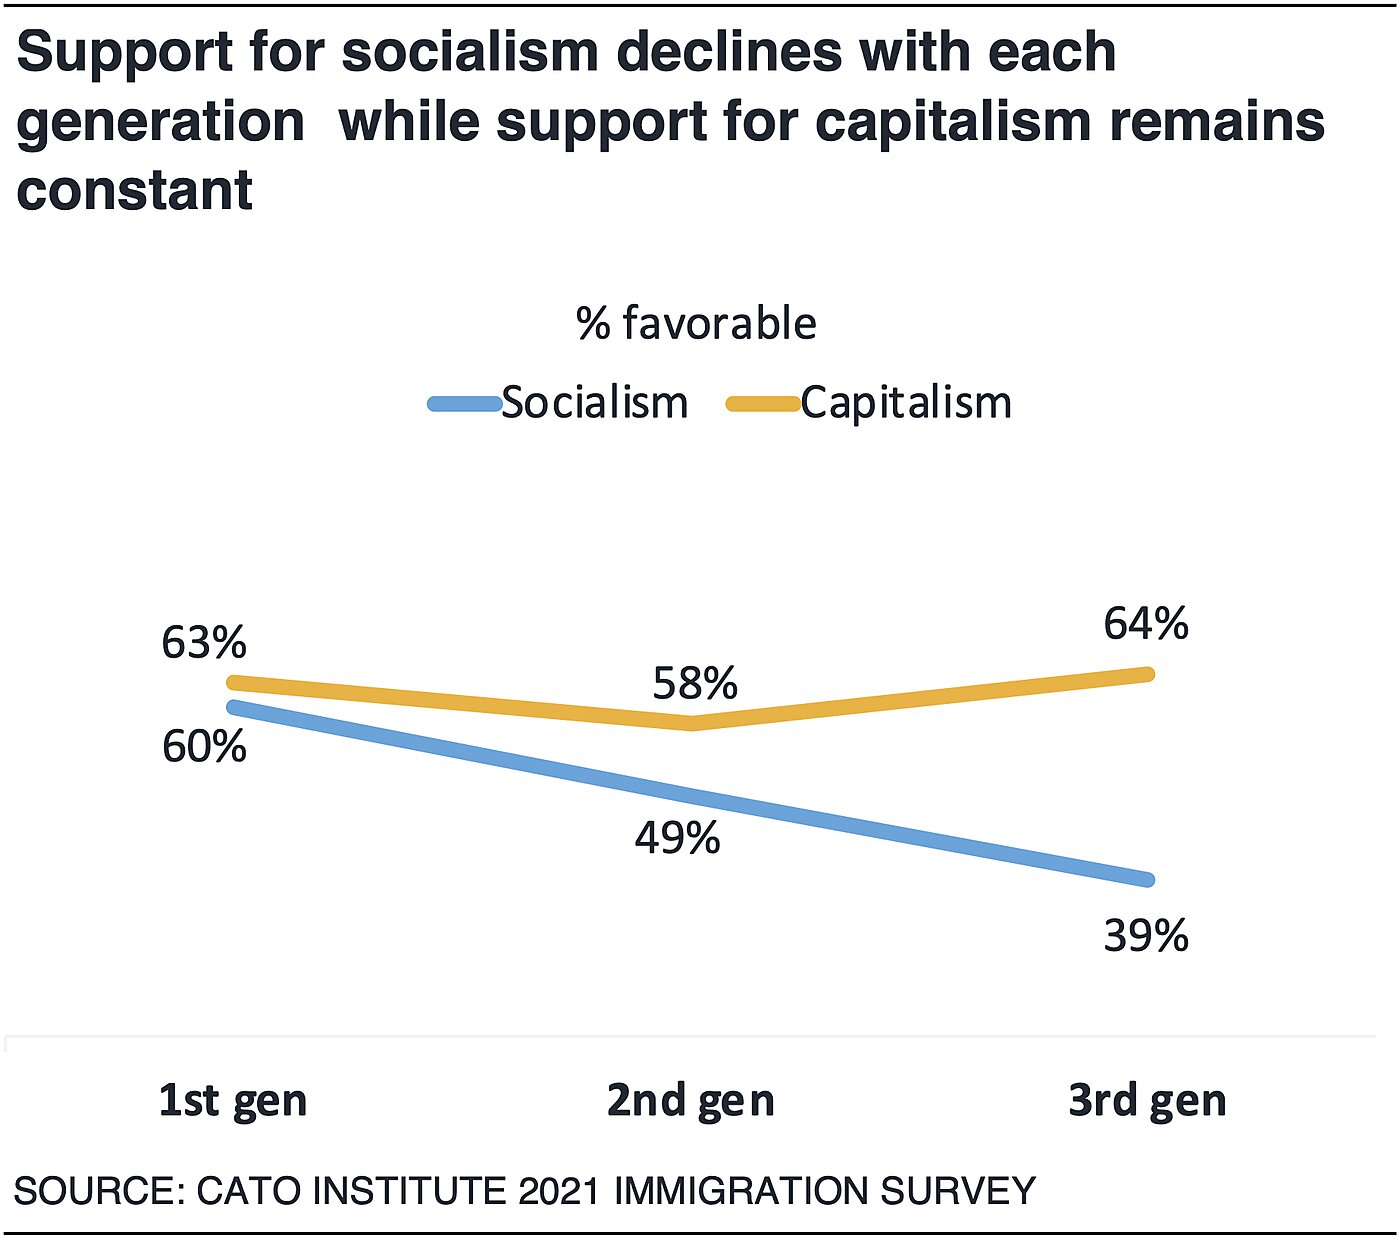
First-generation immigrants hold favorable attitudes of both capitalism (63%) and socialism (60%). However, support for socialism slides among the second generation (49%) and third generation and higher (39%). In contrast, support for capitalism remains fairly high among the second generation (58%) and the third generation and higher (64%).
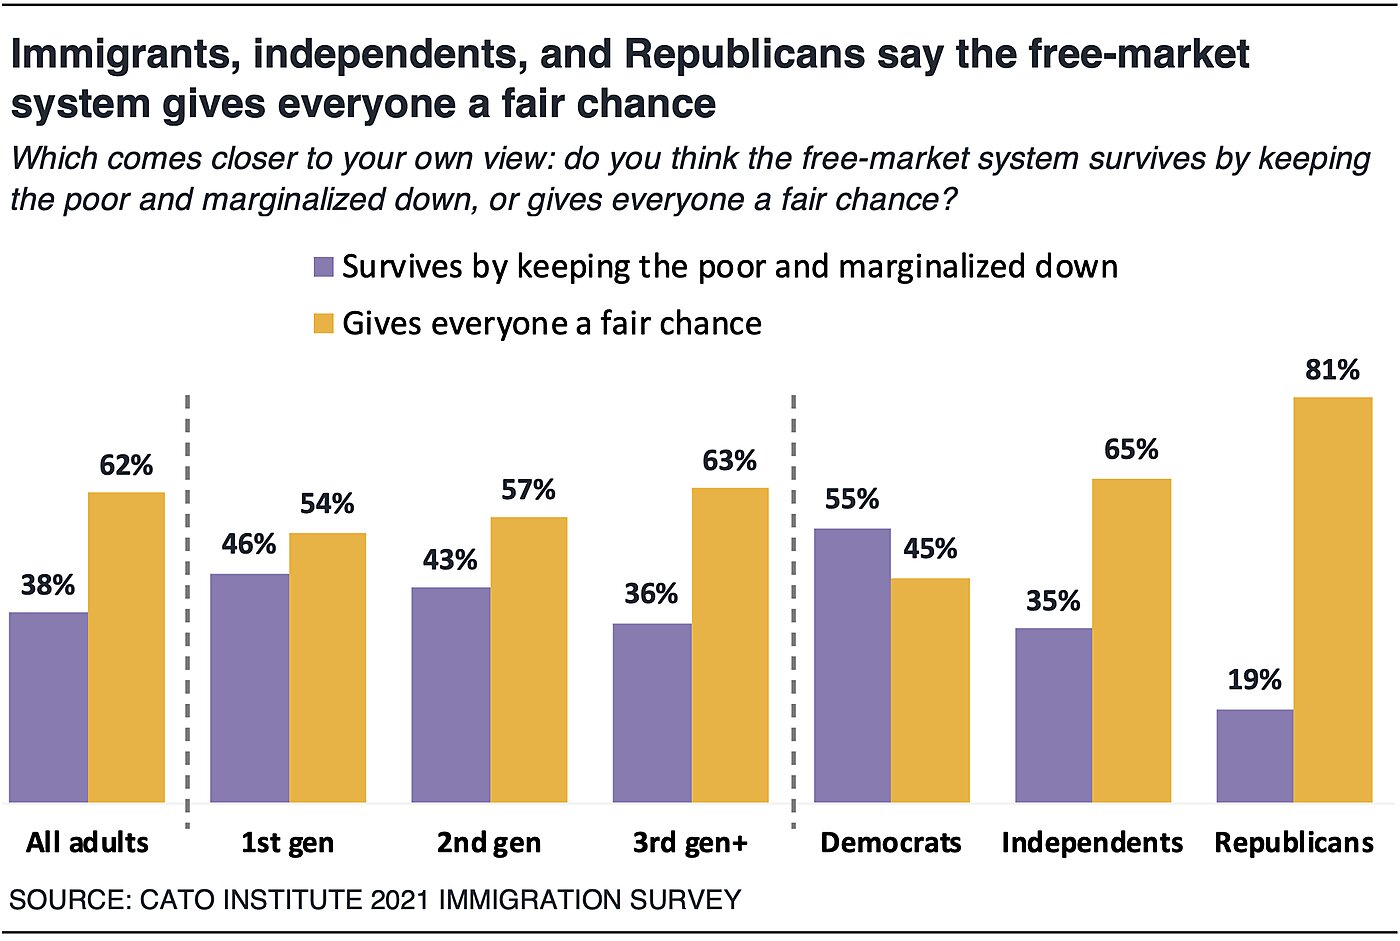
Majorities of Americans across immigration backgrounds (about 6 in 10), Republicans (81%), and independents (65%) believe the free market gives people a fair chance rather than exploits the marginalized. Democrats stand out, with a majority (55%) who feel the free market survives through exploitation.
Methodology
The Cato Institute 2021 Immigration and Identity National Survey was designed and conducted by the Cato Institute in collaboration with YouGov. YouGov collected responses online March 5 to 15, 2021 from a national sample of 2,600 Americans 18 years of age and older. Restrictions are put in place to ensure that only the people selected and contacted by YouGov are allowed to participate. The margin of error for the survey is +/- 2.21 percentage points at the 95% level of confidence.
The topline questionnaire, full methodology, and report of the survey findings can be found here.
