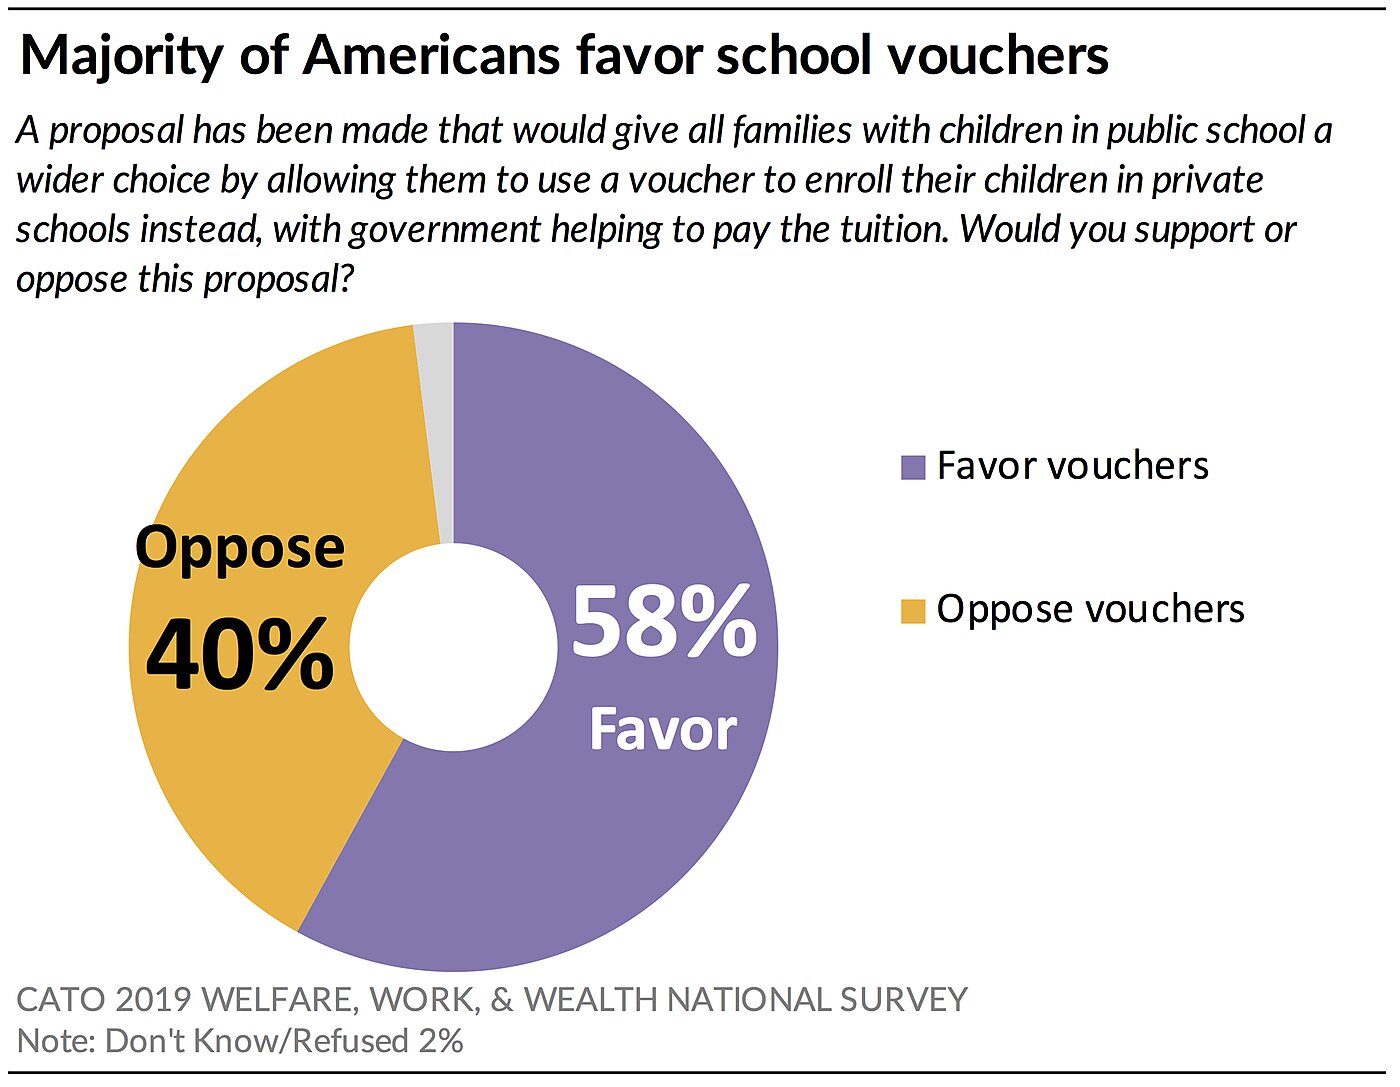
The Cato 2019 Welfare, Work, and Wealth National Survey finds a solid majority (58%) of Americans favor a proposal that would allow parents to use a “voucher to enroll their children in a private school” with “government helping to pay the tuition” while 40% oppose.
Full survey results and report found here.
African Americans, lower-income Americans, high school graduates, and Republicans are most likely to favor letting parents use vouchers to send their kids to private school.
More than two-thirds (69%) of African Americans support school vouchers, compared to 56% of White and Latino Americans.
Nearly three-fourths (73%) of people with annual incomes below $20,000 and 64% of high school graduates support school vouchers. But support drops among those with incomes above $20,000 and college graduates to 55% and 52%, respectively. Nevertheless, slim majorities continue to favor the proposal.
Republicans (68%) and independents (61%) are more supportive of school vouchers than are Democrats (47%). Instead, 50% of Democrats oppose such a proposal.
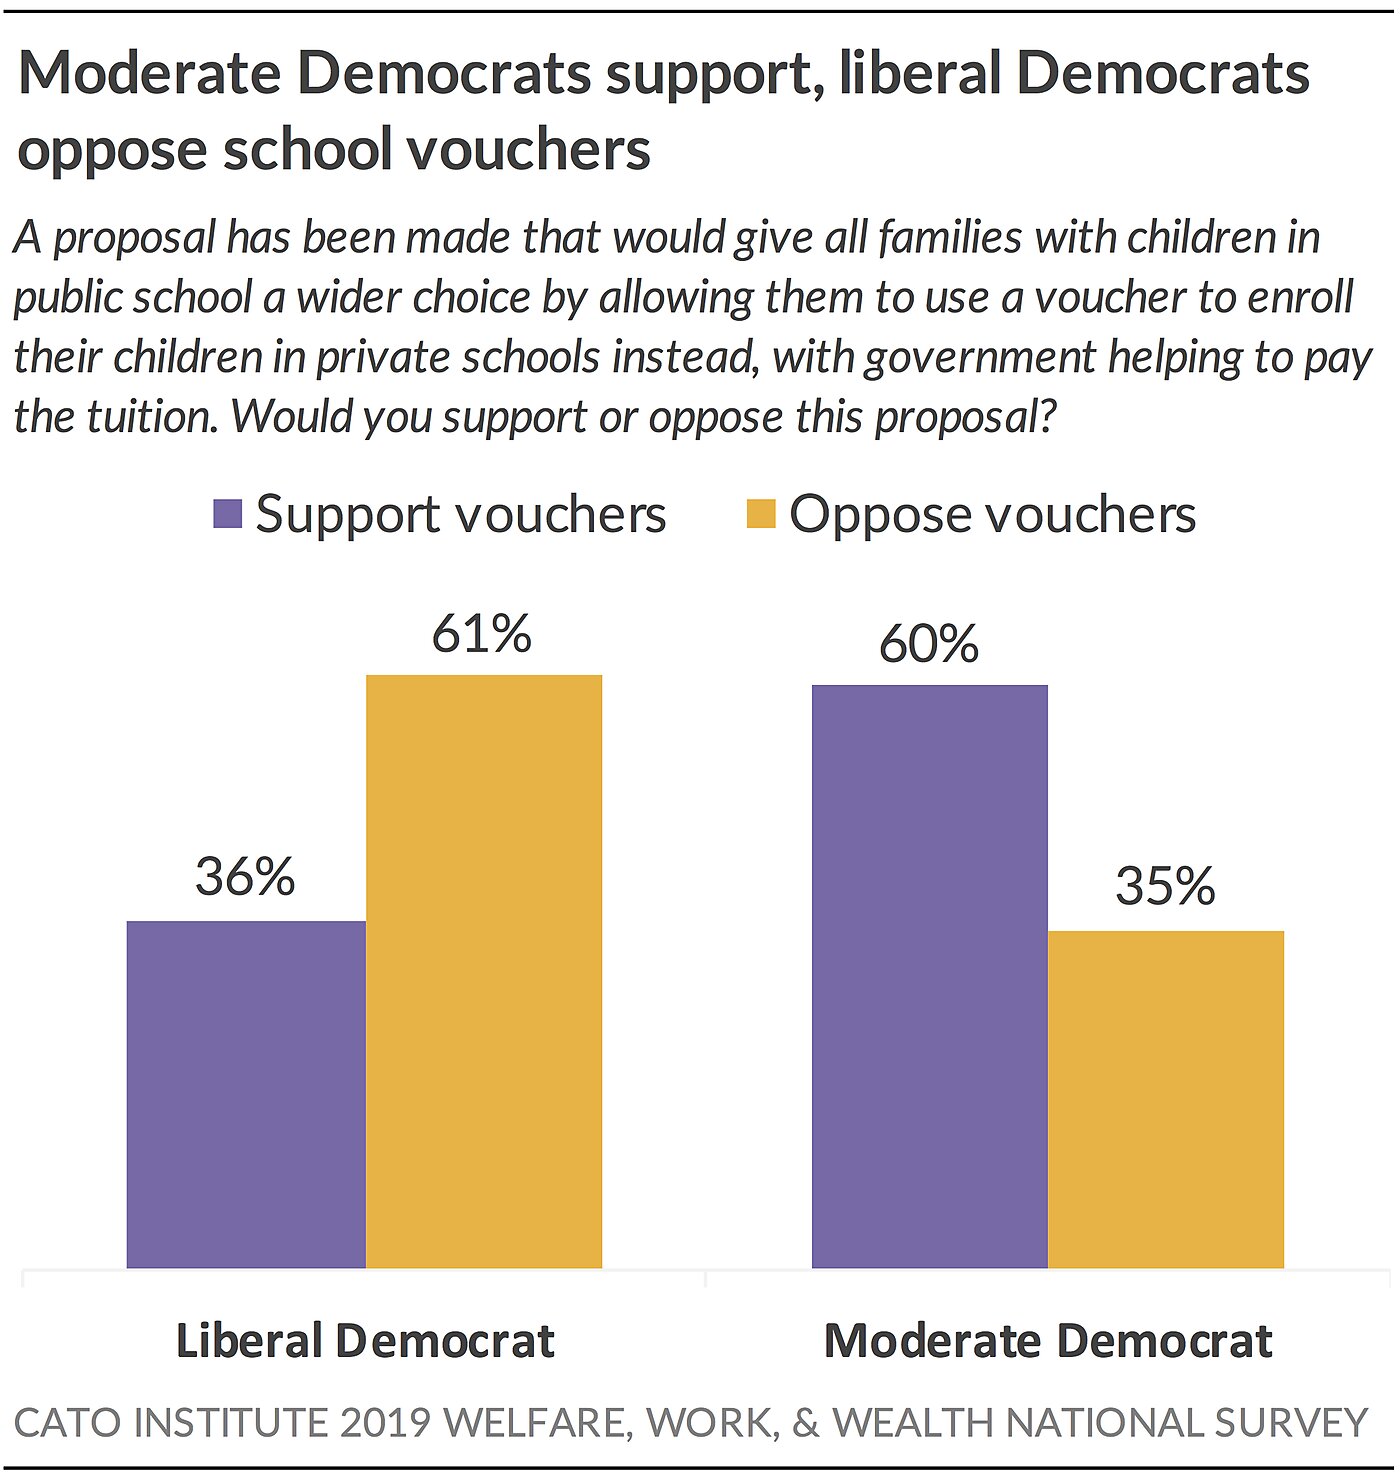
School vouchers divide Democrats. A strong majority (61%) of liberal Democrats oppose school vouchers while a solid majority (60%) of moderate Democrats favor them.
55% of Americans Would Prefer to Send Their Kids to Private School; 59% of Democrats Prefer Public School
About 90% of children in elementary and secondary schools attend public schools.[1]But a majority (55%) of Americans would rather send their kids to a private school. This may help explain why a majority of Americans support vouchers for private school.
Majorities of Latino (57%), White (54%), and Black (51%) Americans prefer that their kids receive an education through a private school. But, young Americans stand out with their preference for public education. A slim majority (52%) of those under 30 prefer public to private school. However, Americans over 30, including those 30–44 (51%), 45–54 (56%), and over 55 (61%), would prefer private school.
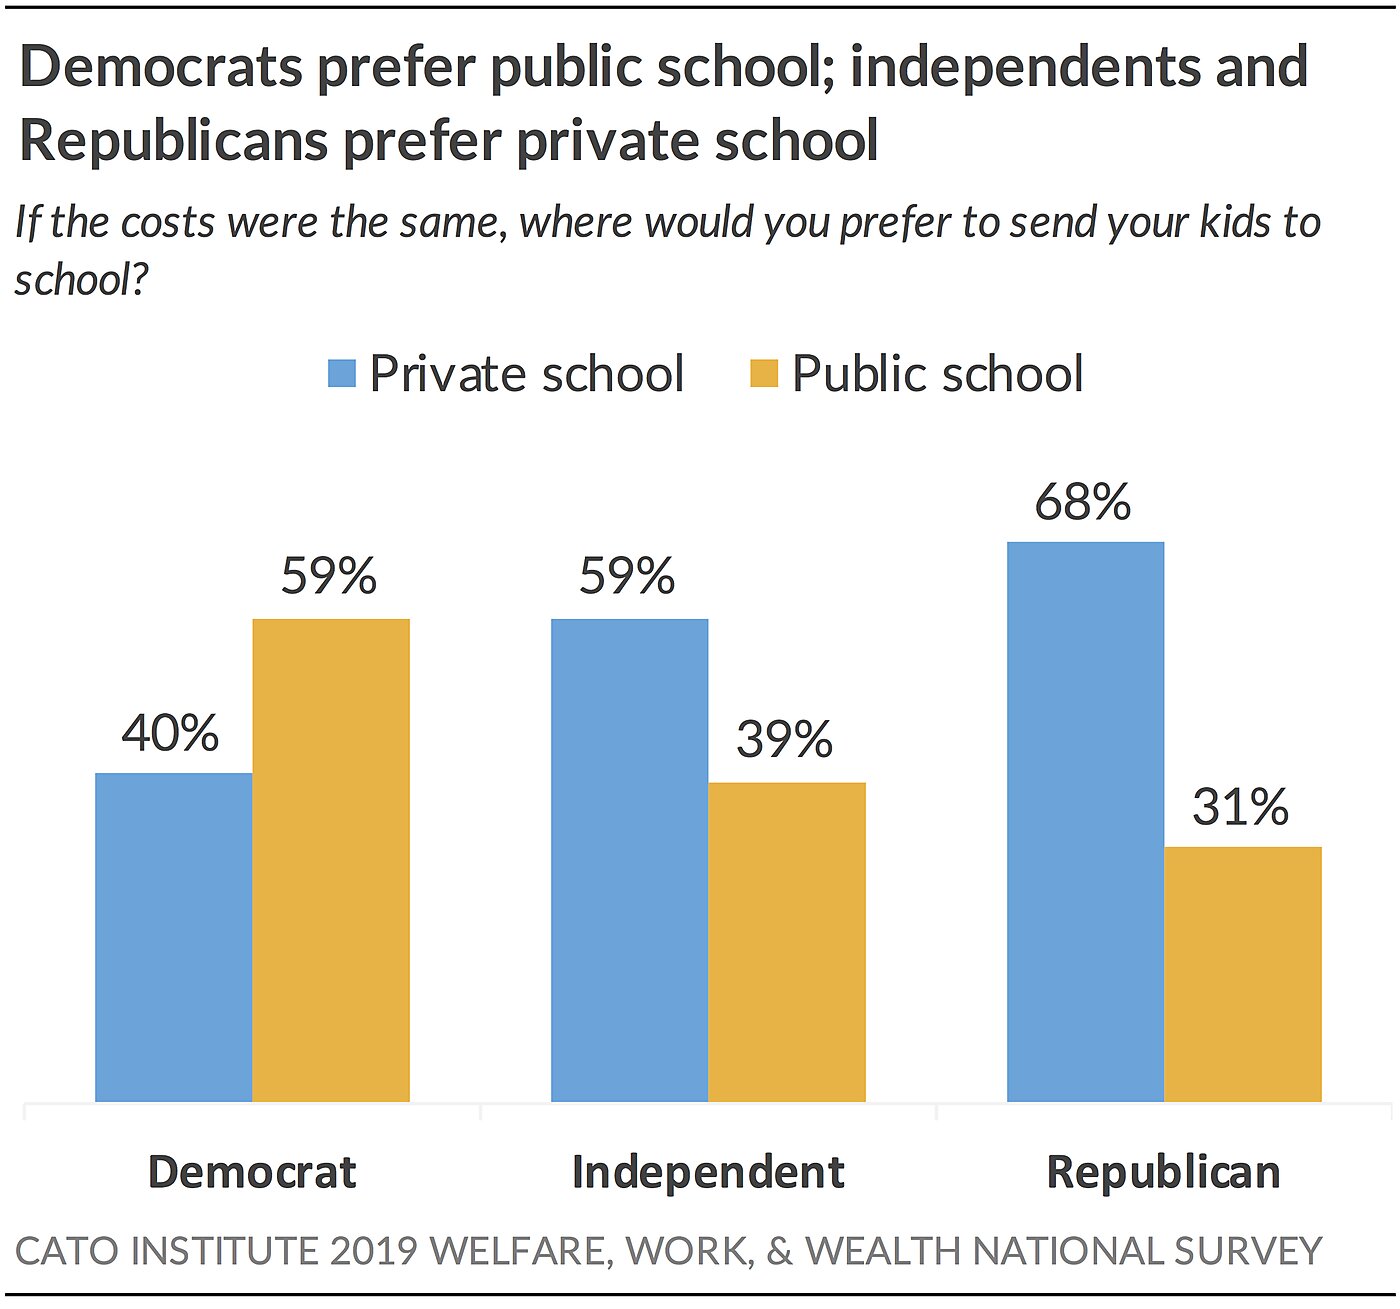
There are striking partisan differences. More than two-thirds of Republicans (68%) and a majority (59%) of independents would rather send their kids to private school. However, a solid majority (59%) of Democrats prefer public school for their kids. This share rises to 65% among strong liberals.
25% of Americans Rate Their Local Public School as “Bad”
One reason why many Americans may prefer private schools is that they believe their local schools are of low or mediocre quality. A quarter (25%) of Americans currently rate the educational quality of schools in their neighborhoods as “somewhat” or “very bad.” Another 47% rate their local schools as “somewhat good,” and 27% say their schools are “very good.” Notably, lower income families are more likely to rate their local schools poorly. For instance, 37% of low-income respondents currently receiving welfare benefits rate their local schools as “bad.”
61% of Americans Support Tax Credits for Those Who Donate Toward Private School Scholarships
It is more expensive for a parent to send their children to a private school than a locally assigned public school. However, 61% of Americans favor a proposal to offer a tax credit to people or businesses “who donate to scholarships to help parents send their children to private school if they choose.” Another 37% oppose this proposal.
The proposal enjoys wide demographic and post-partisan support. Majorities of Black (62%), Latino (65%), and White (60%) Americans, as well as Democrats (52%), independents (66%), and Republicans (69%) all favor tax credits for donations to private school scholarships.
The issue, however, divides moderate and liberal Democrats. Two-thirds (67%) of moderate Democrats support the tax credit proposal while 56% of liberal Democrats oppose.
65% of Americans Support Offering Higher Salaries to Math and
Science Teachers
Nearly two-thirds (65%) of Americans support offering higher salaries to math and science school teachers and 34% oppose. This proposal also enjoys post-partisan support: 71% of Democrats, 63% of independents, and 59% of Republicans favor raising salaries for math and science teachers.
Read more of the survey report here.
The Cato Institute 2019 Welfare, Work, and Wealth Survey was designed and conducted by the Cato Institute in collaboration with YouGov. YouGov collected responses online March 5 to 8, 2019 from a representative national sample of 1,700 Americans 18 years of age and older. The margin of error for the survey is +/- 2.2 percentage points at the 95% level of confidence.
Sign up here to receive forthcoming Cato Institute survey reports.
[1]“Table 105.20: Enrollment in Elementary, Secondary, and Degree-Granting Postsecondary Institutions, by Level and Control of Institution, Enrollment Level, and Attendance Status and Sex of Student: Selected Years, Fall 1990 through Fall 2027,” Digest of Education Statistics, National Center for Education Statistics, U.S. Department of Education, https://nces.ed.gov/programs/digest/d17/tables/dt17_105.20.asp?current=….


