“Is the Phillips Curve Dead?” asked Princeton economist Alan Blinder in a May 3 Wall Street Journal article. The former Vice-Chairman of the Fed noted that “the correlation between unemployment and changes in inflation is nearly zero… Inflation has barely moved as unemployment rose and fell.”
For a veteran Ivy League Keynesian like Blinder to doubt the Phillips Curve was doctrinal heresy, comparable to a monetarist asking if money matters or a supply-sider wondering aloud if a 91% tax rate is better than a 28% rate.
Wall Street Journal columnist Greg Ip later explained the dilemma and expanded it: “Standard models of the economy are built on a simple relationship: When unemployment goes down, inflation eventually goes up. That relationship, dubbed the Phillips Curve, has looked sickly for years. In Japan, it may be dead.” Unemployment is 2.5% in Japan, yet inflation is 1.1% and only 0.4% if we leave out energy and food (“core” inflation). For that matter, the unemployment rate is 2.0% in Singapore yet inflation is 0.2%.
Paul Samuelson and Robert Solow first fabricated a “Phillips Schedule” in 1960 using a wage-push notion of inflation and U.S. data from 1934 to 1958. Leaving aside the Great Depression and WWII price controls, they concluded “it would take more like 8 per cent unemployment to keep money wages from rising. And they would rise at 2 to 3 per cent per year with 5 or 6 per cent of the labor force unemployed.” Despite caveats that this relationship might shift, American economists soon began speaking of a trade-off between lower unemployment and higher inflation, notably the alleged necessity to tolerate 4% inflation in order to get unemployment down to 4%. Those statistical goals were replaced with others (the curve was said to have shifted), but such Phillips Curve trade-off never went away.
“Pushing the Economy Up the Phillips Curve” in Brad DeLong’s 2002 Macroeconomics textbook, for example, says because of “the Federal Reserve’s expansionary monetary policy… unemployment fell from 7 percent in 1986 to 5.4 percent in 1989. As unemployment fell inflation rose from 2.6 percent in 1986 to 4.4 percent in 1989.” Although that 3‑year span is described as a short-term relationship, any student could be forgiven for thinking that if you want 2.6% inflation you’ll have to settle for 7% unemployment, but if you prefer 5.4% unemployment you’re likely to end up with higher (4.4%) inflation. [In reality, no Phillips Curve could explain why PCE inflation briefly fell from 3.5% in 1985 to 2.2% in 1986, or why it recovered to 4.3% in 1989].
As Blinder and Ip observe, however, the Phillips Curve is embarrassingly out of touch with international and domestic evidence. Yet the Federal Reserve’s “standard models of the economy,” like those of the Congressional Budget Office, remain critically dependent on it. They have no other inflation theory.
Rather than basing monetary policy on actual inflation data, diehard Phillips Curve loyalists assume that low unemployment is such a fool-proof indicator of invisible inflation that the Federal Reserve must now raise interest rates repeatedly and preemptively – with the unspoken goal of pushing unemployment up above the CBO’s current 4.73% estimate of the non-accelerating rate (NAIRU).
The late Bill Niskanen and I wrote an obituary for the Phillips Curve sixteen years ago. Instead of the presumed negative relationship whereby a low unemployment rate supposedly causes to accelerate, we found “a strong positive relationship between the inflation rate and the unemployment rate two years later.”
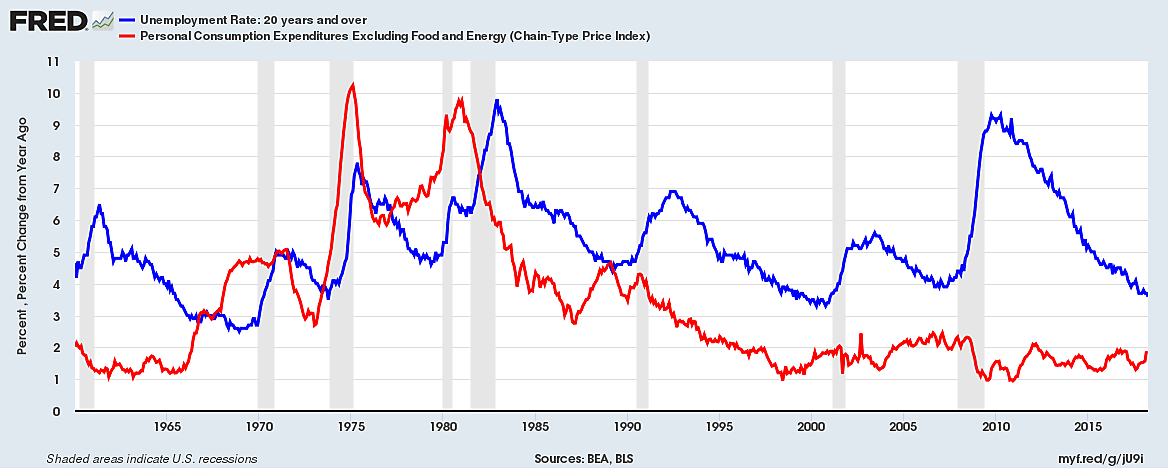
Don’t take our word for it. Look at the graph.
The blue line is the monthly adult unemployment rate, excluding teens. The red line is a smoothed year-to-year trend in “core” PCE inflation, leaving out energy in particular to reveal that the 1970s inflations were definitely not just oil shocks.
On any given month, the year-to-year trend of inflation would be mostly composed of old 11-months of old news, unlike the current jobless rate. That makes it even more obvious that core inflation was rising well before the big spikes in unemployment in 1974–75 and 1980–82, and that inflation rose alongside high and rising unemployment (i.e., “stagflation”). Inflation causes high unemployment, which does not mean low unemployment causes inflation.
As Blinder noted, there has been no significant change in overall inflation since 2000, regardless of the oil price spike in 2008. On the contrary, with the exception of three recessions (one very bad), the period since 1983 mainly shows a long decline in inflation that was usually matched by long periods of falling unemployment.
The Phillips Curve has finally been revealed as a stubborn old 1958–60 theory that cannot predict inflation but does predict that high inflation will end in high unemployment.
