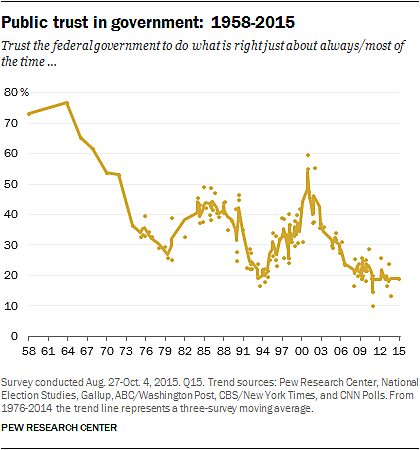
Most of the headlines about the large new Pew Research Center survey (6,000 interviews) have focused on the continuing decline in Americans’ trust in government, as depicted in the chart below.
But the survey also asks one of my favorite questions:
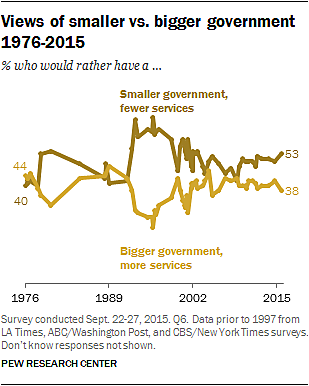
If you had to choose, would you rather have a smaller government providing fewer services, or a bigger government providing more services?
As shown in the chart below, the number preferring smaller government rose to its highest point during the 1990s, then reached a low point as President Obama was elected in 2008, and has been rising since then. In the latest survey 53 percent of Americans say they prefer a smaller government, while only 38 percent would rather have a bigger government with more services.
But as I’ve written before, I’ve always thought the “smaller government” question is incomplete. It offers respondents a benefit of bigger government–”more services”–but it doesn’t mention that the cost of “bigger government providing more services” is higher taxes. The question ought to give both the cost and the benefit for each option. The Rasmussen poll does often ask the question that way. In one poll about a decade ago, Rasmussen found that 64 percent of voters said that they prefer smaller government with fewer services and lower taxes, while only 22 percent would rather see a more active government with more services and higher taxes. A similar poll around the same time, without the information on taxes, found a margin of 59 to 26 percent. So it’s reasonable to conclude that if you remind respondents that “more services” means higher taxes, the margin by which people prefer smaller government rises by about 9 points. So maybe the margin in this poll would have been something like 58 to 34 if both sides of the question had been presented.
For now, when voters are given only the benefits and not the costs of bigger government, Pew and other pollsters find these results: